
 5 Lessons McKinsey Taught Me That Will Make You a Better Data Scientist

 5 Lessons McKinsey Taught Me That Will Make You a Better Data Scientist
How to stand out from your peers in the data world.
By Tessa Xie, Data Scientist

Photo by Dan Dimmock on Unsplash
Data science is one of the hottest fields in recent years and has attracted tons of talented people to join the competition for a seat in top companies’ data science teams. There are numerous articles out there teaching you how to prep for DS interviews and “stand out from the rest of the interviewees”, but the journey certainly does not stop at getting hired. Getting a job offer is merely the first step; however, not many people talk about how you can stand out from the rest of the hired data scientists once you pass the interviews and join the company.
During my years at McKinsey, I was fortunate enough to work with countless smart data scientists across McKinsey and top companies I served and have observed what the common traits are among those that get the highest ratings and praises from partners and clients alike. And maybe surprising to some of you, the highest performing data scientists are not necessarily the ones that build the fanciest models or the ones that write the most efficient code (of course they have to clear a pretty high bar of technical skills to be hired) but the ones that possess a number of important “soft skills” on top of their analytical abilities. This article summarizes my experience and observations from my time at McKinsey into 5 lessons that will help you become a better data scientist.
As a data person who loves precision, I would like to point out that even though “data scientist” as a title covers a wide range of jobs in the industry nowadays, in this article I’m mostly focusing on tips for data scientists that influence business decisions in any shape or form (rather than those in more research-oriented “core data science” roles).
Lesson 1. Top-down communication is key
Top-down communication, or the pyramid principle, was coined and popularized by McKinsey partner Barbara Minto and is viewed by many people as the most efficient communication structure when it comes to business (or even personal life). Even though it’s second nature to some people like strategic consultants, a lot of data scientists get tripped up on this communication front. The idea is simple: when you try to communicate an idea/argument, it’s the most efficient and the easiest for the audience to follow if you start with a key message, followed by several main arguments supporting this key message; if needed, each argument can be followed by supporting data.
Adopting top-down communication is advantageous for the following reasons:
- The key takeaway is front and center: if you have seen a TLDR at the beginning of an email/memo or an executive summary at the beginning of a research paper, you will understand the importance of this. Having the key message upfront will make sure your audience gets a general idea even if they don’t catch all the details.
- The presentation/communication can be easily tailored towards different audiences: you can prepare one set of communication and keep it on the level of “key message” with main arguments for the c-level executives and extend it with details for peers and other analytical audiences who are interested in the in-the-weeds stuff.
Unfortunately for data scientists, whose work is doing deep-in-the-weeds analyses most of the time, this communication structure might not come naturally and can be counterintuitive. Way too frequently I watch data scientists start a presentation or communication with in-depth details and get the audience lost without getting the key message across.
How to practice it: An easy way to practice this is to jot down your thoughts before the meeting based on this structure to keep yourself on track when communicating your key findings from your analysis. It’s also helpful to frequently take a step back to ask yourself what problem it is you are actually trying to solve; that should be the key message you convey.
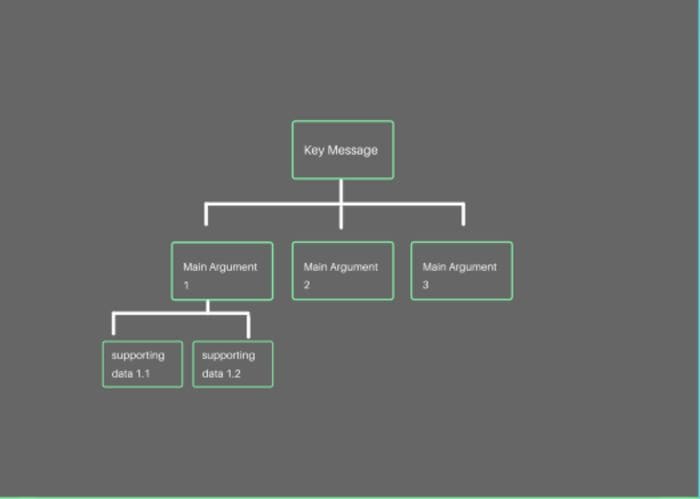
Image by Author
Lesson 2. Be the “translator” yourself
If you look at McKinsey’s suggested blueprint for companies’ data organizations, it emphasizes the importance of a role called “translator” that supposedly functions as the bridge of communication between business and data teams translating analytical insights into actionable ones for the business (I assume this role was born partially from the frustration of the point I made above). I’m sure as a data scientist, you have been asked to “explain it like you are explaining to a five-year-old” or “explain it in plain Eglish”. The data scientists that stand out from the rest are the ones who can do just that — function as their own translator; if asked, they can explain their ML models well to CEOs who have neither an analytics background nor time to read white papers, and they can always tie the results of their analyses back to business impacts. Those data scientists are valued for the following reasons:
- It’s hard to get “translators” from non-analytical people: McKinsey did try to train a group of strategic consultants to be “translators” on different analytics studies; but in my opinion, never succeeded. The reason is pretty simple: in order to accurately explain the key takeaways of complex analyses and accurately reflect caveats, you need an analytical mindset and deep understanding which cannot be achieved through a few weeks of analytics boot camp training. For example, how do you explain the number of clusters you chose for K-means if you don’t know the elbow method? How do you explain the elbow method if you don’t know what SSE is?. As a DS, the time you spend teaching this mostly unsuccessful crash course is probably better spent crafting your own communication style and coming up with the translation yourself.
- Loss of precision can be avoided if DS can explain their own analyses: I believe most people have played the “telephone” game or a variation of it. The longer the information is being passed around, the harder it is to keep its precision. Now imagine the same process happening to your analytics work; if you rely on others to explain/translate your work, the message might diverge quite a bit from reality when it gets to the end-user.
How to practice this: Practice this with a friend (preferably one without any analytical background) by explaining your model/analyses to them (without disclosing any sensitive information of course). This is also a great way to discover knowledge gaps in your approach; like “The Great Explainer” Richard Feynman believes, if you can’t figure out how to explain something in a simple way, a lot of times it’s because you haven't understood it well yourself.
Lesson 3. Being solution-driven is the № 1 rule
This is not limited to data talents; it’s essential for people in any function/role of a company. It’s of course super valuable to be able to identify problems and raise concerns, but what’s even more appreciated is the ability to propose potential solutions. Without a solution-driven person in the room, discussions can often go in circles, obsession over problems rather than trying to figure out a path forward.
At most top consulting firms, being solution-driven is the № 1 rule and in my opinion, this approach should be transferred to the tech world as well. As a data scientist, you might frequently go through frustrating situations when people make ridiculous data asks due to their lack of analytical background. I have seen countless DS not knowing how to handle those situations and fail at stakeholder management for being the constant naysayer. Instead of shutting them down, be solution-driven and help them redefine the ask and limit the scope with your better understanding of the data and analytical tools.
Being solution-oriented doesn’t mean you can never say no to anything or always have to have the perfect solution already drafted up; it means you should always have a “but how about… ” following every “No” you are saying.
How to practice this: When you come across a problem, take a moment to think of potential ways you could address it before flagging it to your team or manager. Use your creativity when it comes to problem-solving and don’t be afraid of being the one proposing a new solution. It’s also helpful to branch out from your workstream and learn more about the business and other teams’ work. Getting the big picture usually helps to connect the dots and lead you to creative solutions.
Lesson 4. Interpretability trumps precision when it comes to modeling in a business context
No one really wants to predict churn, everyone is trying to understand churn
Nowadays, when every single company is building models to predict churn, it’s hard to take a step back to ask yourself why we wanted to predict churn in the first place. Companies want to predict churn so they can find an actionable solution to prevent it. So if your model tells the CEO “the cubic root of #of web visits is one of the most important features indicating churn”, what can he do with that information? Probably nothing…
As a data scientist, like many of you, I used to solely focus on accuracy as the success metric when it comes to modeling. But I gradually came to the realization that increasing the accuracy from 96% to 98% by adding unexplainable features and fine-tuning hyperparameters means nothing to the business if you can’t tie it to business impacts (again, this only applies to business-facing DS, for certain areas of ML, this increase probably means the world).
It’s also hard to gain credibility from the C-level executives if the model is a black box. A model is a tool to guide business decisions at the end of the day, so it shouldn’t be surprising that its value is largely based on its practicality and interpretability.
How to practice this: Always keep the business impact in mind when building models or carrying out analyses. When building models, avoid throwing random interactive features at the model and hope one of them will stick; instead be very thoughtful about the feature engineering stage before even starting to build the model. Writing down the business suggestions coming out of the model/analysis will also help you re-evaluate the design choices you made when building the model.
Lesson 5. Make sure to HAVE a hypothesis but are not married to one

Image by Author
It’s important to have hypotheses as a starting point for most analyses, from feature exploration to exploratory data analyses (EDA). Without hypotheses, you will have no direction for how to slice and dice the data for EDA or which features to test first. Without hypotheses, there’s even no point to carry out AB testing (that’s why it’s called hypothesis testing). But every so often, I observe data scientists who delve into the head-down analysis stage without a clear hypothesis and later get lost in a rabbit hole. Or even more often, data scientists leave the hypothesis structuring process completely to team members with no visibility into data and later realize there’s not enough data to test those hypotheses. The best approach in my opinion is for data scientists to be engaged in those hypothesis brainstorm sessions from the beginning and use hypotheses to guide and prioritize subsequent analyses.
As important as hypotheses are, they should serve as the starting point, not the endpoint. Time and time again I have seen a lot of data scientists (or people who work with data scientists) stick with a hypothesis despite contradictory findings. This “loyalty” to the initial hypotheses would lead to data snooping and massaging data to fit a certain narrative. If you are familiar with “Simpson’s paradox”, you can understand the power of data in telling the “wrong story”. Good data scientists should be able to keep data integrity and pivot the narrative to fit the data instead of the other way around.
How to practice this: It’s important to build up business understanding and acumen in order to come up with good hypotheses. Keep the hypotheses on your mind to guide you during data exploration, but be open-minded to admit when the data is telling you a different story from your initial “educated guess”. Having a good business sense will also help you tweak your initial theory along the way and tweak your narrative according to the data.
When it comes to business-facing roles, people tend to think talents can be separated into two categories: the analytical ones and the strategic ones, as if the two types of abilities sit on the opposite sides of the spectrum. Well, I will let you in on a secret, the best analytical talents are the ones who also understand the strategic/business side of things and understand how to communicate with business stakeholders, and the best talents in strategic roles have a certain level of understanding of analytics and data.
Bio: Tessa Xie is current a Data Scientist in the AV Industry, and Ex-McKinsey Data Scientist; Avid Traveler, Diver and Painter.
Original. Reposted with permission.
Related:
- 10 Mistakes You Should Avoid as a Data Science Beginner
- Data Scientists Will be Extinct in 10 Years
- Data Science is Not Becoming Extinct in 10 Years, Your Skills Might