
 How to Create Stunning Web Apps for your Data Science Projects

 How to Create Stunning Web Apps for your Data Science Projects
Data scientists do not have to learn HTML, CSS, and JavaScript to build web pages.
By Murallie Thuwarakesh, Data Scientist at Stax, Inc.

Photo by Meagan Carsience on Unsplash
Web development isn’t a data scientist’s core competency. Most data scientists don’t bother to learn different technologies to do it. It’s just not their cup of coffee.
Yet, most data science projects also have a software development component. Developers sometimes have a different understanding of the problem, and they use discrete technologies. It often causes problems and drains the precious time of both teams unproductively.
Also, visualization tools such as Tableau and Power BI focus more on data exploration. Yet, it’s only part of a complete data science project. If you need to integrate a machine learning model, they are far from perfect.
Streamlit allows you to develop web apps for your data science projects. This open-source library’s API is entirely in python. Hence you don’t have to learn any other web technology to use it. Also, it’s straightforward to learn and flexible for modifications.
This article is an introduction to Streamlit. We’ll build an interactive web app that takes user inputs, runs a K-means algorithm, and instantly plots the results in a web interface.
By the end of the short article, we’d have covered
- installing Streamlit and testing the water;
- Building an interactive web app;
- running K-means algorithm with user inputs;
- using cache to improve performance, and;
- deploying it on the cloud;
Here is the link to the deployed version. Check it out if you want a sneak peek.
Setting up Streamlit for development.
This extraordinary tool has an embarrassingly simple setup, and almost all Python users are familiar with it. Use PyPI.
pip install streamlit
You can also use conda and other popular python package managers.
Once completed, you can test it with a hello world app that comes with the installation. Execute the below command in a terminal window to start the development server.
streamlit hello
The hello world app is a set of excellent visualization you can do with Streamlit. The above command will start a local development server and open the link in your default browser. You can also find the source codes on the same page. In addition, this sample app also has links to lots of advanced tutorials to educate yourself.
Now that the setup is complete, let’s create an app to interact with our machine learning model.
Using machine learning models with a Streamlit web app.
The app below uses Pandas, Scikit-Learn, Matplotlib, Seaborn, and Streamlit. Before starting, make sure you have installed all the required packages. If not, the below command will do it for you.
pip install pandas scikit-learn matplotlib seaborn streamlit
Creating your first web app
Create a file named ‘quickstart.py’ with the below content.
# Imports
# -----------------------------------------------------------
import streamlit as st
import pandas as pd
# -----------------------------------------------------------

# Helper functions
# -----------------------------------------------------------
# Load data from external source
df = pd.read_csv(
    "https://raw.githubusercontent.com/ThuwarakeshM/PracticalML-KMeans-Election/master/voters_demo_sample.csv"
)
# -----------------------------------------------------------

# Sidebar
# -----------------------------------------------------------

# -----------------------------------------------------------


# Main
# -----------------------------------------------------------
# Create a title for your app
st.title("Interactive K-Means Clustering")

# A description
st.write("Here is the dataset used in this analysis:")

# Display the dataframe
st.write(df)
# -----------------------------------------------------------
The above file is straightforward. For illustration purposes, I’ve added sections to the file.
In the main app section, we have three lines. We added a title and a description to the page. Then we display the data frame on the page. The “st.write” function is an all-in-one solution. You could pass almost anything into this function, and Streamlit is smart enough to display the correct widget in the UI. To learn about different Streamlit functions, here is a cheat sheet.
Let’s run our initial app with the below command.
streamlit run quickstart.py
Like the hello app, this command will start a new development server. On your browser, you’ll see the below.
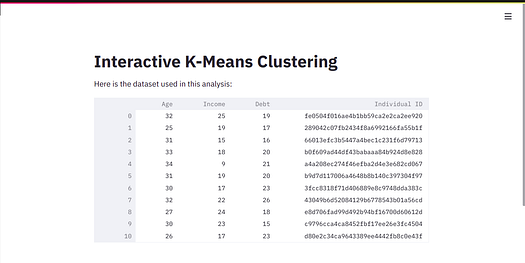
Screenshot from the author.
Congratulations, you just created your first web app; without HTML, CSS, and absolutely no JavaScript.
But this is rudimentary. A web app could do lots of cool stuff. It could interact with the user in real-time and update its content. Let’s see how we can do it.
Adding interactions
Bringing interactions in the Streamlit web app is effortless. The Streamlit API contains several widgets. You can use them to get the user input and store its value in a variable. The rest is like any other python program.
Let’s add a checkbox to toggle the dataset display. After all, no one develops a web app to see the raw data. Replace the data frame display (line 30) with the below content.
# Display the dataframe
df_display = st.checkbox("Display Raw Data", value=True)

if df_display:
    st.write(df)
Code snippet from the author.
If you refresh your browser, now you can see a checkbox to toggle the data frame display.
Screenshot from the author.
But a toggle button in the middle of the app is not pleasing. Let’s move it to a sidebar.
Adding a sidebar to the app
Again, another effortless action. The Streamlit API has the sidebar property. All the widgets you created in the main app are also available in this sidebar property.
Create a sidebar variable by using the ‘st.sidebar’ property. Then move the checkbox assignment we added in the main app section to the sidebar section. Notice we now use ‘st.sidebar.checkbox’ instead of ‘st.checkbox.’
# SIDEBAR
# -----------------------------------------------------------
sidebar = st.sidebar
df_display = sidebar.checkbox("Display Raw Data", value=True)

n_clusters = sidebar.slider(
    "Select Number of Clusters",
    min_value=2,
    max_value=10,
)
# -----------------------------------------------------------
Code snippet from the author.
In the above code, we’ve also added a slider to the sidebar. This widget will capture the user-selected number of clusters. Here is how the output will look.
Screenshot from the author.
Next stop, we’ll run the K means algorithm with the user-selected number of clusters.
Running K-Means with live inputs.
Extend the imports, helper functions, and main app sections with the below code.
# Imports
# -----------------------------------------------------------
...
from sklearn.cluster import KMeans
import matplotlib.pyplot as plt
import seaborn as sns

sns.set_theme()
# -----------------------------------------------------------

# Helper functions
# -----------------------------------------------------------
...
def run_kmeans(df, n_clusters=2):
    kmeans = KMeans(n_clusters, random_state=0).fit(df[["Age", "Income"]])

    fig, ax = plt.subplots(figsize=(16, 9))

    #Create scatterplot
    ax = sns.scatterplot(
        ax=ax,
        x=df.Age,
        y=df.Income,
        hue=kmeans.labels_,
        palette=sns.color_palette("colorblind", n_colors=n_clusters),
        legend=None,
    )

    return fig
# -----------------------------------------------------------

# MAIN APP
# -----------------------------------------------------------
...
# Show cluster scatter plot
st.write(run_kmeans(df, n_clusters=n_clusters))
# -----------------------------------------------------------
In the above code, we’ve created a function to run the K-Means algorithm. It takes the data frame and the number of clusters as arguments and returns a Matplotlib figure.
The illustration of K-Means clustering is beyond the scope of this project. It’s a machine learning algorithm, and that’s what we care about. But you can refer to my previous post that describes it.
We use the n_clusters variable that captures the slider value in the previous section as the second argument to the run_forecast function.
If you refresh the page, you’ll see a dashboard that takes user input, runs a machine learning algorithm, and instantly updates the UI.
Screenshot from the author.
Even if you are an experienced developer, this level of interaction and integration with back-end ML is a difficult task. Especially if you are a data scientist who doesn’t know how to develop web apps, it might take weeks of your time.
Improving performance with caching.
Some tasks in a data science pipeline are time-consuming. Yet, such tasks rarely produce different results for the same inputs. You can use Streamlit’s inbuilt caching functions to store their values for future use.
Although it might sound complicated, doing it with streamlit is simple. Your time-consuming task should be a function, and you wrap it with the @ts.cache decorator. As long as the input parameters are the same and the function’s body is untouched, Streamline will fetch it from the cache.
In the app we built, we call the external URL to download data. If it’s a live API, you may not want to cache it. But in our case, it’s not. Therefore let’s cache it by replacing the line with the below code.
# Load data from external source
@st.cache
def load_data():
    df = pd.read_csv(
        "https://raw.githubusercontent.com/ThuwarakeshM/PracticalML-KMeans-Election/master/voters_demo_sample.csv"
    )
    return df

df = load_data()
On your first reload, you may see a message “Processing load_data” on your browser. But subsequent reloads won’t have that note. This is because requests are fetched from the cache instead of downloading from the external URL.
Deploying on the internet
If you’ve noticed the Streamlit console, you’ll also see a network URL. It means, if your firewall allows, your app can be accessible over the intranet.
But if you want to share it outside your network, we have many options. As the documentation says, Streamlit apps work anywhere a Python app works.
- Streamlit Recommends the “Streamlit Sharing” option.
You can put your code on a GitHub repository and configure Streamlit Sharing to serve your app.
Streamlit sharing is free, but it’s currently invitation only. You can request an invitation for yourself. - You can deploy it on cloud platforms. Here is an article that shows how to do it with AWS EC2 free instance.
- You can configure a reverse proxy. Proxy servers like Nginx and Apache can be configured to serve the app and restrict access for specific users.
Be sure to read Streamlit’s community guide about deployment to explore numerous options available to you.
Here is how I deployed this tutorial app on Streamlit Share. Once again, Streamlit didn’t fail to surprise me with its convenience.
Step I: Put your code into a GitHub public repository.
I’ve added my code to this GitHub repo. We need to make sure that it contains a requirement.txt file with all the dependencies.
Step II: Log into Streamlit using your GitHub account.
Step III: Create a new app on the Streamlit console.
Choose your git hub repo from the dropdown or past in the URL. Select the branch that you want to use for the deployment. Finally, pick the main filename and click deploy.
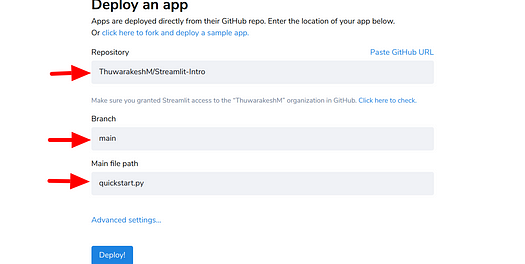
Screenshot by the author.
In about a minute, my app is live on Streamlit Share. But time to deployment may vary depending on the project requirements.
Notice that streamlit share is currently an invitation-only thing. But I didn’t wait too long to get it. Streamlit’s deployment documentation contains a lot more helpful information on this.
Conclusion
Needless to say, Streamlit solves a critical problem in data science projects. It gives data scientists the power to build web apps to interact with their machine learning models.
In this introductory article, we’ve explored how we can use Streamlit with K-Means clustering. Although it’s a trivial application, it illustrates the core concepts of this technology. Besides development, we’ve also seen how effortless managing cache for performance in Streamlit. Lastly, we talked about the deployment options.
Streamlit is much more than this. Please check their official documentation, which is filled with excellent tutorials. Also, their API cheat sheet is helpful for rapid development.
A web app is a wonderful solution. But in some cases, you might have to think of other ways to interact with your ML models. Perhaps, building a command-line interface to your model could help.
A Simplified Guide to Create CLIs for Your Data Science Project
Thanks for reading, friend! It seems you and I have lots of common interests. I’d love to connect with you on LinkedIn, Twitter, and Medium
Not a Medium member yet? Please use this link to become a member. You can enjoy thousands of insightful articles and support me as I earn a small commission for referring you.
Bio: Murallie Thuwarakesh (@Thuwarakesh) is a Data Scientist at Stax, Inc., and a top writer on Medium for Analytics. Murallie shares what he explores in data science every day.
Original. Reposted with permission.
Related:
- Streamlit Tips, Tricks, and Hacks for Data Scientists
- Topic Modeling with Streamlit
- Build an app to generate photorealistic faces using TensorFlow and Streamlit