How I Built A Perfect Model And Got Into Trouble
Data-driven decisions, actionable insights, business impact—you've seen these buzzwords in data science jobs descriptions. But, just focusing on these terms doesn't automatically lead to the best results. Learn from this real-world scenario that followed data-driven indecisiveness, found misleading insights, and initially created a negative business impact.
By Oleg Novikov, Data Science Manager, ex-Uber.

The Model
I was working at a fashion e-commerce website and built a product ranking model to show visitors the most relevant products. The idea was to predict if a user would click on a product they see. Based on this score, we then would show the products with the highest expected click-through-rate first.
A large and clean dataset with views and clicks was ready, and I used it to train the model. Some fit-predict magic, and, voila, we had the predictions on whether a user clicks on the product. The ROC AUC measured on train/test split was close to 0.9. I was happy with the work I had done and was ready to put this on my achievements list. But, alas, life had other plans.
The Metric
To quantify our success, we ran a controlled experiment on real users. A few weeks later, an A/B test showed a double-digit increase in CTR in the treatment group. Happy, I started browsing articles on how to negotiate a promotion. It’s not every day that you make such a business impact at this scale!
A few more days passed by, and it turned out that along with the uplift in CTR, the number of orders in the treatment group actually went down. Here’s what happened: the model optimised for products with catchy images, and it resulted in window-shopping behaviour. Rather than increasing sales, it actually led people away from buying!
I quickly updated the model to predict purchases instead of a CTR. And, to account for delayed conversions, it allowed for one week window between seeing a product and placing the order. Another experiment, a few more weeks of waiting, and the results were ready: both CTR and 7-day conversion were up. We had twice as many orders in the treatment group!
My joy didn’t last long as it turned out that the average basket size went down. Each order was half the value, which means visitors in control and treatment spent exactly the same amount. Apparently, the price was the most outcome-defining feature in the model. Instead of coats, we started selling a lot of underwear.
A few weeks later, a colleague mentioned a drop in order returns. We had a free return policy for one month after the purchase, and most people tended to send their goods back around this deadline.
This was good news, wasn’t it? Return-related expenses (shipping, return handling, customer support costs) went down, and so did the costs, in general. While visitors in control and treatment spent the same amount, the drop in costs brought the contribution margin up, making an average order in treatment group profit-making. My promotion was a slam dunk!
The Finance
Now let’s take a look at the earnings report of an online retailer.
It starts with the Key Performance Indicators. Remember when we improved the number of orders but decreased the average basket size?
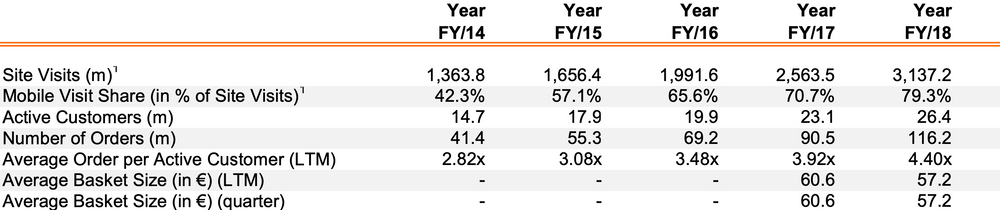
Then we have the income statement, and it starts with the top-line — revenue. Revenue is essentially the amount users paid, and, in our case, it’s equal to the number of orders multiplied by the average basket size.

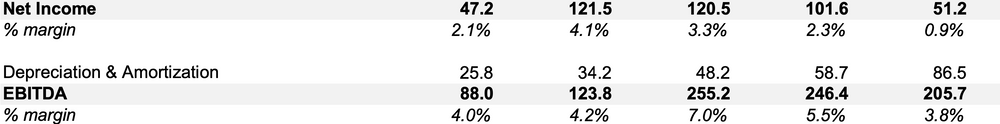
Then we have the costs, and we contributed to this part by reducing the return-related expenses.

And finally, we have the bottom-line — profits.
As we were trying to optimize for different metrics, from conversions to profits, we followed the same order as in the financial report:

Speaking of our high-performance model, how did it affect the business performance?
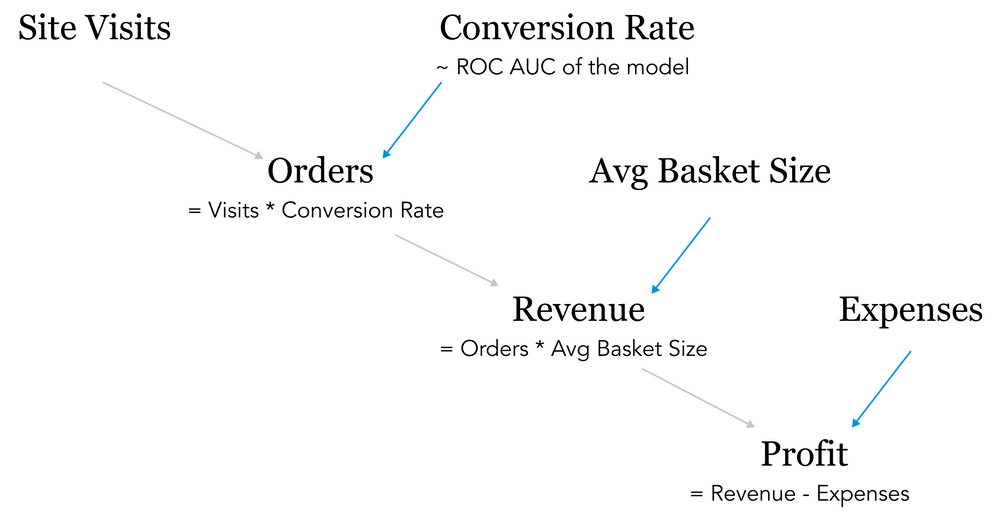
Our original hypothesis was that by building a model with a high ROC AUC, we would increase CTR, which, in turn, was supposed to have a positive impact on conversion. These conversions would generate more revenue, which was expected to drive up the profits. In our case, all of these ideas turned out to be wrong. Whoops!
The Indecisiveness
Let’s get back to our experiment with equal revenue in control and treatment. As our model doubled the number of orders, it also resulted in an increase in the new buyers that created accounts and subscribed to our email updates. We were selling everyday items that people regularly buy, so some of the new users would come back and order again. In the following months, a significant number of users made repeated purchases and generated recurring revenue. Bingo, we made the right choice!
What Would You Do?
As a side project, I built a data science interview chatbot and included this case study. Over a thousand people provided their text answers, not biased by a set of pre-defined options, and here’s the distribution of the results:

- “You built a product ranking model that is expected to improve the relevance of product catalogues. What would you choose as the primary metric to help you decide if this model is better than the previous one?”
- 47% of responses include clicks, click-trough-rate and similar metrics
- 34% orders, conversion rate, revenue, and other sales-related metrics
- 19% session length, customer satisfaction and other UX metrics
- 12% ROC AUC, RMSE, precision/recall and other ML performance metrics
- 8% website visits, customer satisfaction, and other unpopular options
(the total exceeds 100% as some responses mention several metrics from different groups)
- “It turned out the users that saw the new version made twice as many purchases but each order was half the value compared to the control group. What other metrics would you look at to decide which version is better?”
- 83% revenue, total spend amount and other revenue-related responses (in fact, revenue is equal between two versions)
- 8% retention, lifetime value, frequency of purchases and other long-term metrics
- 5% profit, cost of acquisition, operating expenses, return rate and other cost metrics
- 3% customer satisfaction, NPS, and similar qualitative data points
- 1% new customers, user acquisition
- "Would you make the same decision about the results of this experiment if it wasn’t a clothing store but an online grocery store?"
- 68% no (because “retention is higher”, “groceries expire and have smaller profitability margin”, etc)
- 32% yes (because “statistics works everywhere”, “data is objective”, “both are retail”, “the goals are the same”, etc)
The Summary
In its guide to product metrics, Mixpanel recommends this simple question to test whether you’re dealing with a good indicator: “If we improve this number, will the product’s long-term performance improve?”
We just walked over three different metric types: ML model performance, product metrics, and business metrics. You can evaluate the model performance based on historical data, but it might be too far from the business goals. The business metrics take a longer time to measure, but, at the end of the day, our models are expected to have a positive impact on the bottom line.

A good metric can be tracked and serves as a proxy to long-term business performance. And while it might be hard and time-consuming to track the direct impact on profits, the closer we can get, the better.
Related: