Create Synthetic Time-series with Anomaly Signatures in Python
A simple and intuitive way to create synthetic (artificial) time-series data with customized anomalies — particularly suited to industrial applications.
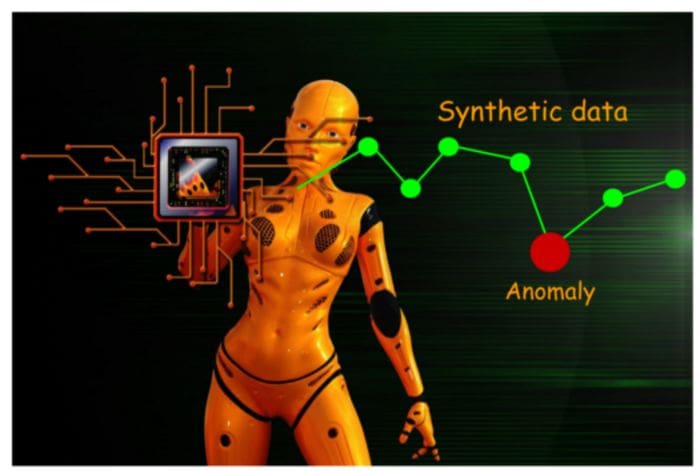
Image source: Author created with Pixabay (Free to use) image
Why synthetic time-series?
As I wrote in my highly-cited article, “ a synthetic dataset is a repository of data that is generated programmatically. So, it is not collected by any real-life survey or experiment. Its main purpose, therefore, is to be flexible and rich enough to help an ML practitioner conduct fascinating experiments with various classification, regression, and clustering algorithms.”
Synthetic data generation — a must-have skill for new data scientists
Synthetic time-series is no exception — it helps a data scientist to experiment with various algorithmic methods and to prepare for real-life deployment in ways that could not have been possible with only real datasets.
Time-series data in an industrial setting
There are a variety of rich applications of time-series analysis in modern industrial settings where an army of sensors are creating a never-ending stream of digital data from machines, factories, operators, and business processes.
Pressure. Temperature. Vibration and acceleration of the motorized components. Quality inspection data. Operator action logs.
The numbers never stop coming. This is the new norm for Industry 4.0 or the Age of Smart Factory. Although both structured and semi-structured data are on the rise, a lot of it is still a wide variety of time-series (or time-series-like) data coming from all the measurement taps embedded in a modern factory.
Factory 2030 - The 'Coming of Age' of The Smart Factory - Metrology and Quality News - Online…

Image source: Pixabay (Free to use)
Anomaly detection is critical
Most of the time, they are ‘OK’, ‘within range’, ‘as expected’. But on rare occasions, they are not. And, that’s where you need to pay attention. These are ‘anomalies’ in an otherwise normal data stream and they need to be caught, analyzed, and acted upon — almost always on a real-time basis.
Anomaly detection in these data streams is the bread and butter of all modern data analytics products, services, and startups. They are employing everything from tried and tested time-series algorithms to the latest neural-network-based sequence models to detect these anomalous signatures and to create alerts or to act as the business logic demands.
There are a variety of rich applications of time-series analysis in modern industrial settings where an army of sensors are creating a never-ending stream of digital data…
Synthetic data generation is a powerful aid
There are a few points about these industrial data streams that are worthy of repeating to understand why a synthetic time-series generation may turn out to be incredibly useful.
- Real-life anomalies are rare and one needs to monitor and process a lot of data to detect all kinds of interesting anomalies. This is not favorable news to the data scientist who wants to test and re-test a laundry list of algorithms in a short amount of time.
- The occurrence of anomalies is so unpredictable that their patterns are hardly captured in any well-rounded statistical distributions. Rapid experimentation with a lot of anomaly types is critical to producing a robust and reliable anomaly detection system. In the absence of a regular, trustworthy source of anomaly data, a synthetic approach provides the only hope of achieving some sort of controlled experimentation.
- Many of the industrial sensor-generated data are considered highly secretive and are not allowed to go beyond the local private cloud or the edge-analytics system in place. To reproduce the signature of anomalies without compromising data security, a synthetic approach is an obvious choice.
These are ‘anomalies’ in an otherwise normal data stream and they need to be caught, analyzed, and acted upon — almost always on a real-time basis.
In this article, we show a simple yet intuitive way to create a few common types of anomaly signatures in one-dimensional synthetic time series data mimicking an industrial process. We will use everyone’s favorite Python language for this.
NOTE: This is not an article about anomaly detection algorithms. I only discuss the ideas and methods related to the synthetic generation of anomaly-infused time-series data (focused on a particular application area).
Synthetic time-series with anomalies
Here is the Jupyter notebook and here is the Python module with the main class object for you to play with it.
The idea of an industrial process and ‘unit process time’
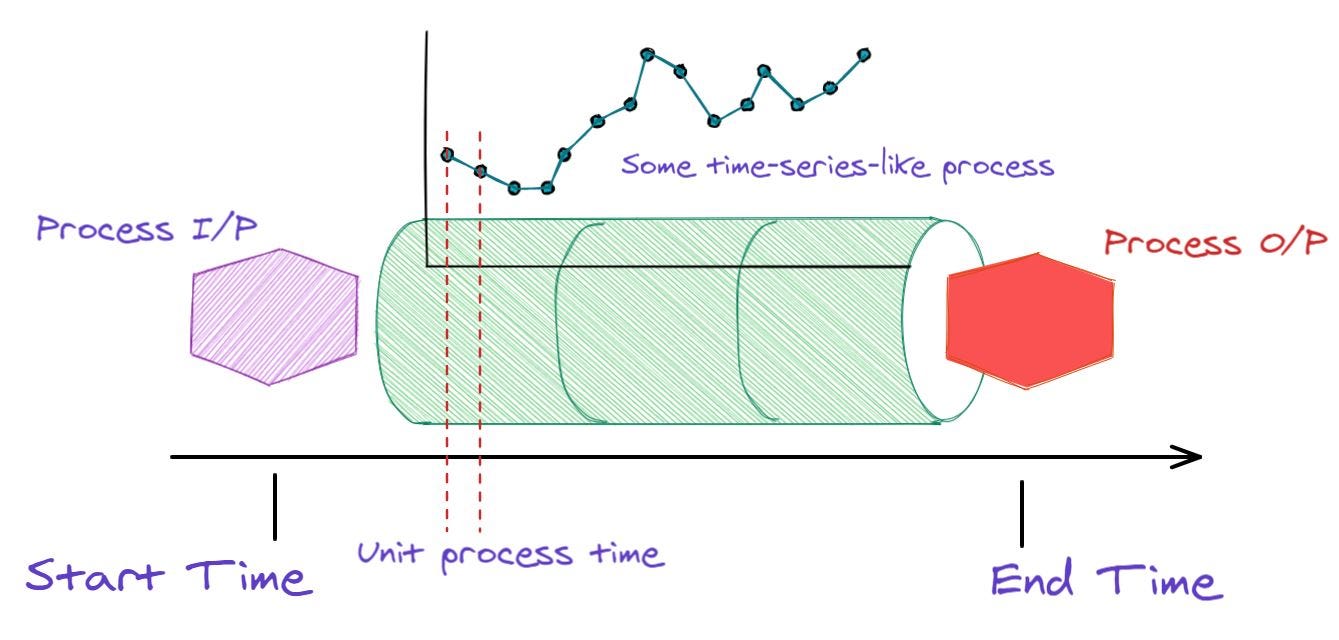
Image source: Author created
Above, we show an illustration of a typical industrial process and a ‘unit process time’. Imagine some raw material (Process I/P in the image) is entering a complex machine and finished goods (Process O/P in the image) are coming out at the other end.
We don’t need to know what exactly goes on inside the machine except that it generates some data at regular intervals i.e. we can measure the states of the process in a time-series fashion (using some sensors, perhaps). We want to look at this data stream and detect anomalies.
Therefore, to define our synthetic time-series module, we need the following at the minimum,
- Process start time
- Process end time
- Unit process time (the interval at which we receive the data)
Therefore, that’s how the definition of the base SyntheticTS class starts,

The ‘normal’ process
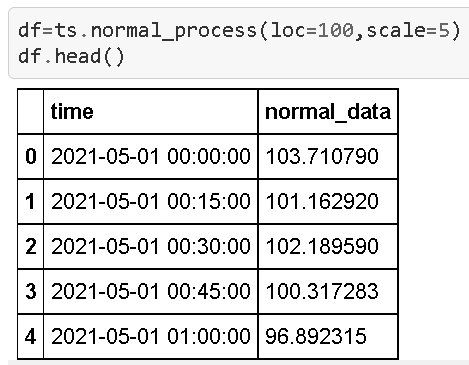
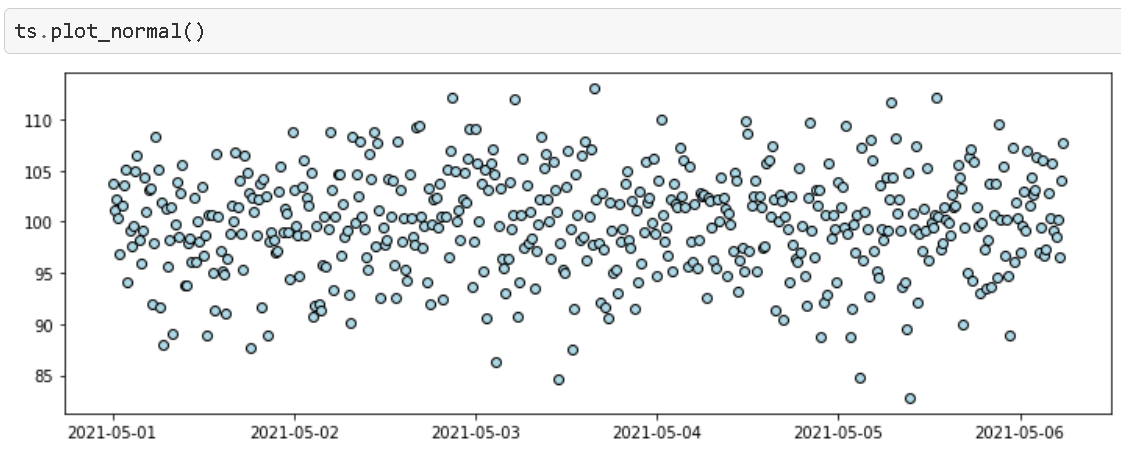
To generate anomalies, we need a baseline normal. We can literally use the ‘Normal distribution’ for this. You can change it anytime depending on your specific process type and situation, but a significant majority of industrial processes do follow the Normal distribution in terms of their sensor measurements.

Imagine we have an industrial process/machine starting up on 1st May 2021 and running till 6th May 2021 (a 6-day run typical in many situations before the weekly maintenance). The unit process time is 15 minutes. We chose the mean of the process as 100 with a standard deviation of 5.

The essential ‘anomalize’ method
As a synthetic data generation method, you want to control the following characteristics of the anomalies,
- Fraction of the data that need to be anomalous
- The scale of the anomaly (how far they lie from the normal)
- One-sided or two-sided (higher or lower than the normal data in magnitude)
We will not bother about the exact code but show you some key results instead.
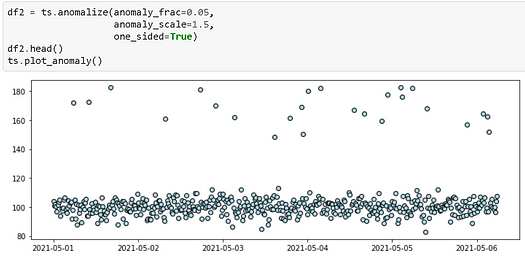
One-sided anomaly
Here is an example,
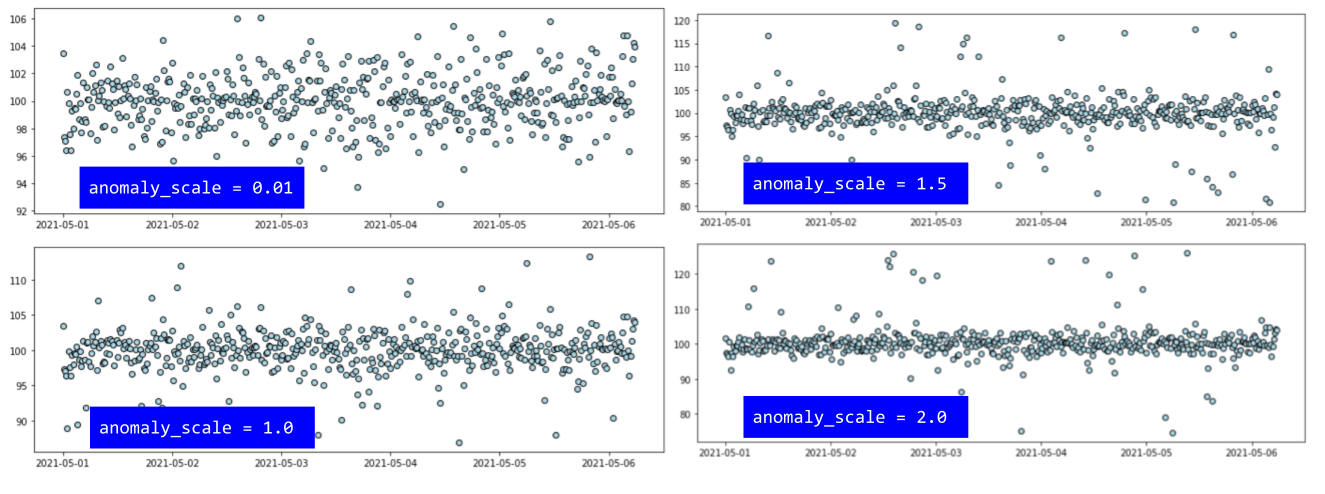
Varying the anomaly scale
We can place the anomalies at various distances by simply varying the anomaly_scale parameter.
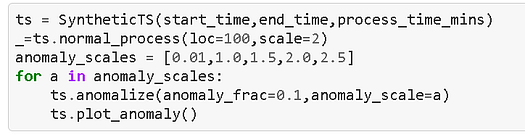
Here are the resulting plots. Note how the vertical scale of the plots is changing to accommodate larger and larger anomalies.
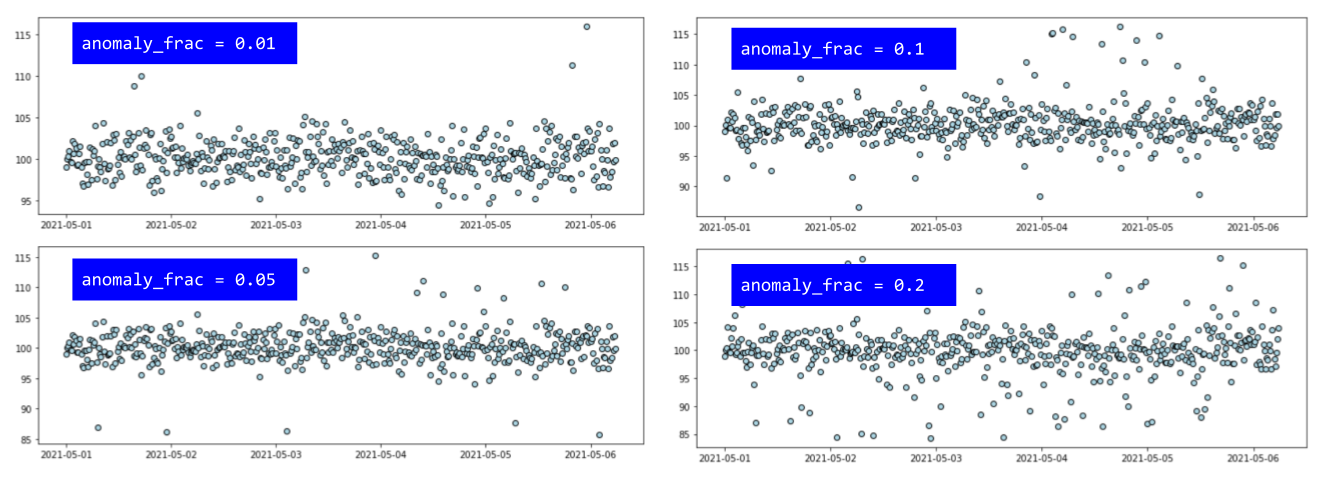
Varying fraction of anomalies
Next, we change the fraction of the anomalies (keeping the scale the same at 2.0).
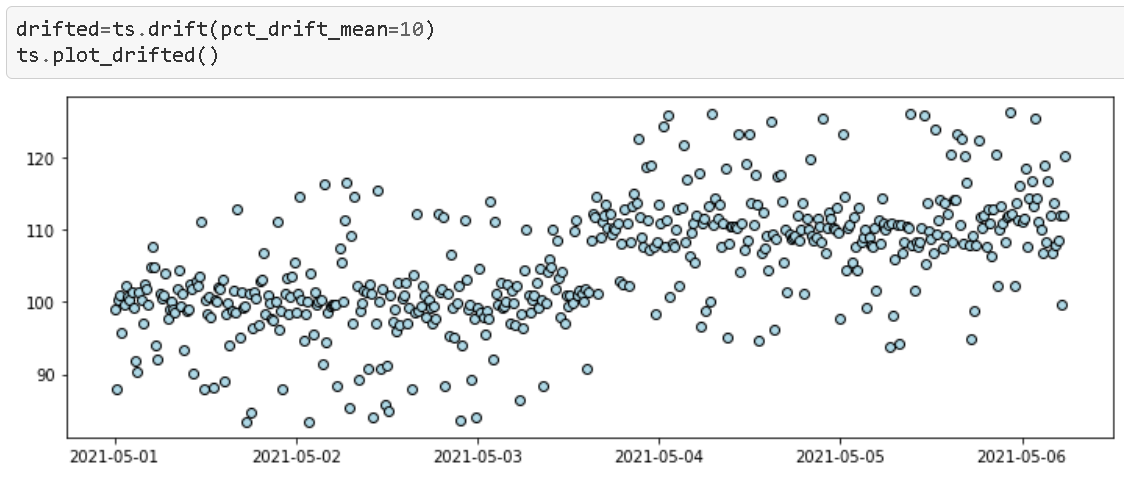
Introducing a ‘positive shift’
This is a fairly common situation in industrial processes where a visible shift is introduced in the process due to a sudden change in the process/ machine settings or some other reason. Sometimes it is planned and sometimes it is unintentional. Depending on the situation, the anomaly detection algorithm may have to analyze and process it differently. In any case, we need a method to introduce such a shift in the synthetic data.
In this case, we have chosen a 10% shift in the data i.e. mean with pct_drift_mean=10 argument. Note that if we do not specify the argument time_drift in the method then the code automatically introduces the drift exactly at the halfway point between the start and end times of the whole process.
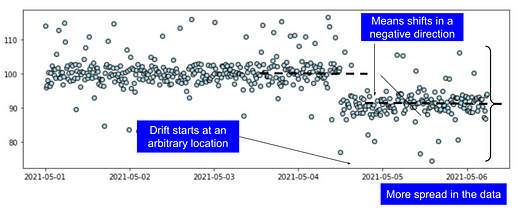
Negative shift at a particular location
In the following example, we show a situation where,
- the data is drifted in a negative direction
- the spread (variance) of the data has changed along with the mean
- the drift started at a particular location which can be chosen by the user
This is a more realistic situation.
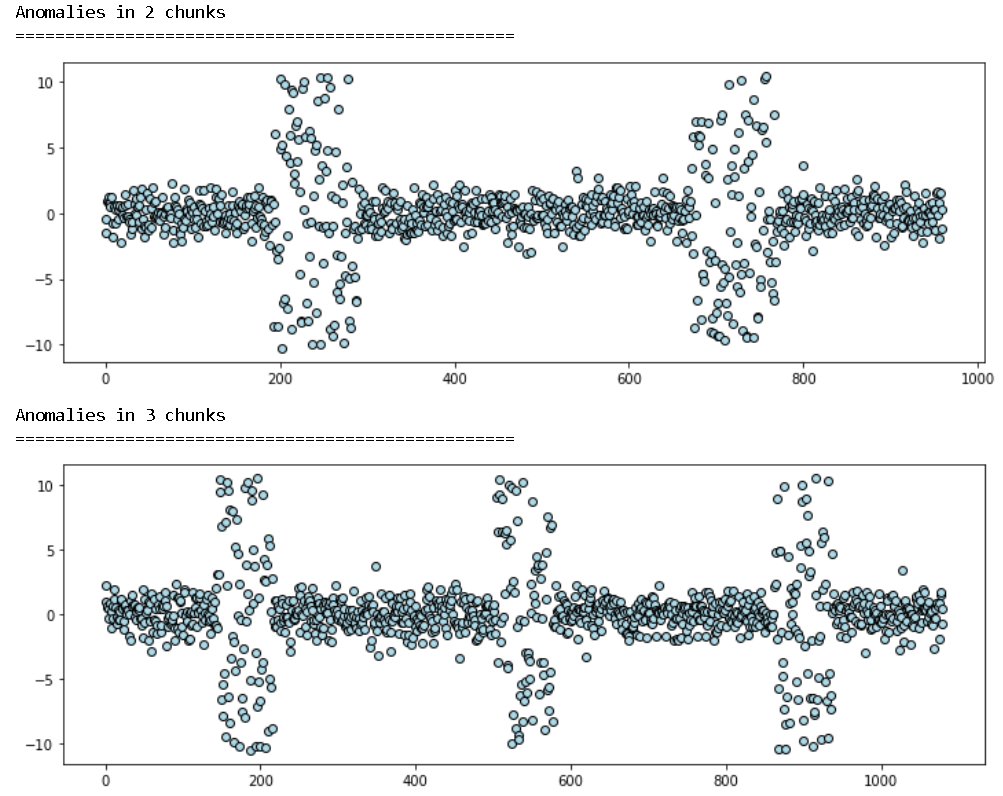
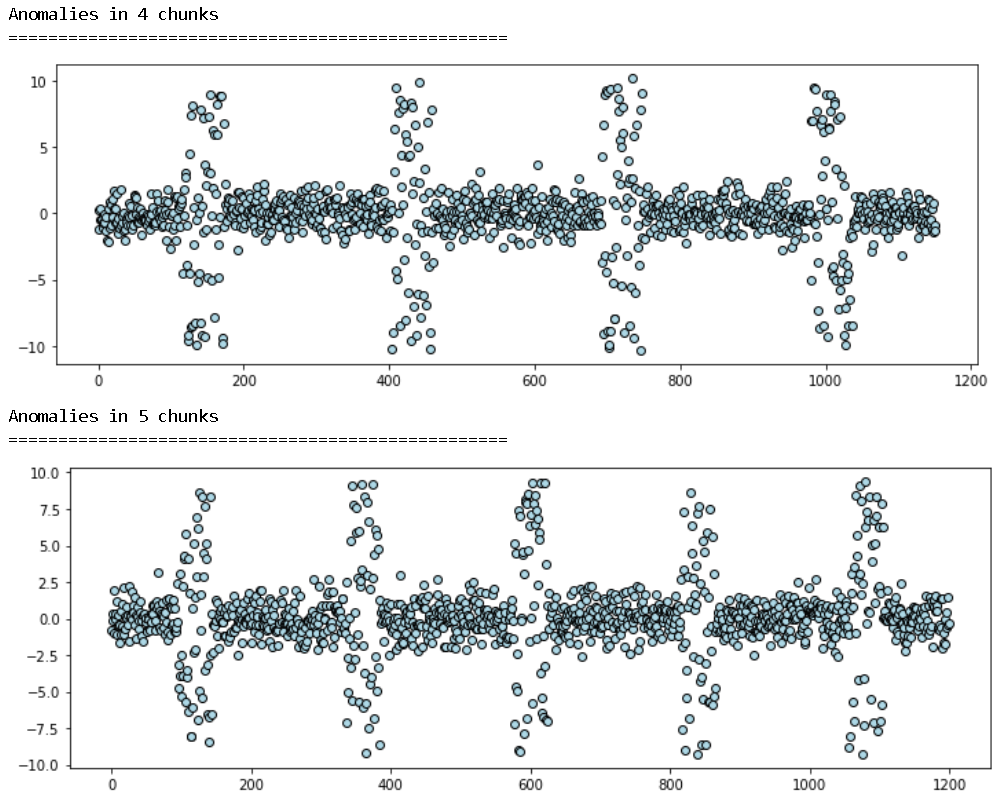
Chunked anomalies
In many cases, the anomalies come in chunks and disappear. We can synthesize this situation too. Note, here we create “two-sided anomalies”, but similar to all other options, we can create “one-sided” variation too.
Right now, the code creates the chunked anomalies scattered uniformly throughout the time period. But this can be customized with individual time-points and anomaly characteristics for the chunks in the next code update.
Summary
We demonstrate the idea of a simple and intuitive way to create synthetic one-dimensional time-series data with various anomaly signatures which are common in industrial use cases. This kind of synthetic data generation technique can be highly useful for algorithmic iteration and model testing.
Keeping it simple
To focus on the industrial use cases, we have not added traditional time-series patterns (e.g. seasonality, upward/downward trend) in the baseline data generation and kept it extremely simple as a Gaussian process. There is also no auto-regressive nature to the data. Although algorithms such as ARIMA are extremely popular and helpful for financial and business data analysis, independent sensor-generated in the industrial settings are often Normally distributed and we stick to that principle.
Further improvements
There are so many ways you can build upon this and add additional features. Some of them could be,
- Adding the choice of various statistical distributions as the baseline data generation process
- Arbitrary location and characteristics for chunked anomalies
- Composition methods for multiple synthetic data classes/objects
- Better visualization methods
Again, the example Jupyter notebook is here. Please feel free to fork and experiment.
You can check the author’s GitHub repositories for code, ideas, and resources in machine learning and data science. If you are, like me, passionate about AI/machine learning/data science, please feel free to add me on LinkedIn or follow me on Twitter.
Bio: Tirthajyoti Sarkar is a Data Science/ML Manager at Adapdix Corp. He contributes regularly to publications such as KDnuggets and TDS on diverse topics related to data science and machine learning. He has authored data science books and contributes to open source software. Tirthajyoti holds a Ph.D. in EE and is working on an M.S. degree in Computational Data Analytics. Email him at tirthajyoti at gmail[dot]com.
Related:
- Teaching AI to Classify Time-series Patterns with Synthetic Data
- 3 Data Acquisition, Annotation, and Augmentation Tools
- Build a synthetic data pipeline using Gretel and Apache Airflow