 Teaching AI to Classify Time-series Patterns with Synthetic Data
 Teaching AI to Classify Time-series Patterns with Synthetic Data
How to build and train an AI model to identify various common anomaly patterns in time-series data.
What do we want to achieve?
We want to train an AI agent or model that can do something like this,
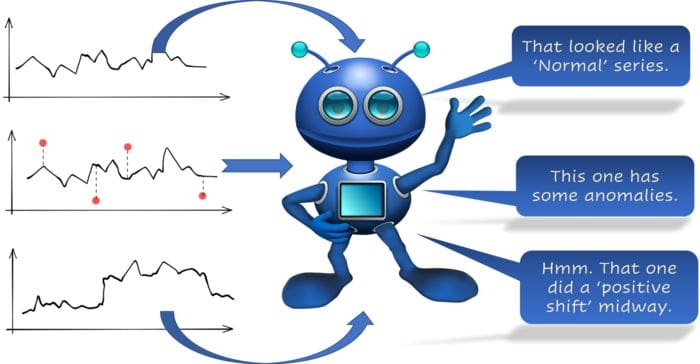
Image source: Prepared by the author using this Pixabay image (Free to use)
Variances, anomalies, shifts
Little more specifically, we want to train an AI agent (or model) to identify/classify time-series data for,
- low/medium/high variance
- anomaly frequencies (little or high fraction of anomalies)
- anomaly scales (are the anomalies too far from the normal or close)
- a positive or negative shift in the time-series data (in the presence of some anomalies)
But, we don’t want to complicate things
However, we don’t want to do a ton of feature engineering or learn complicated time-series algorithms (e.g. ARIMA) and properties (e.g. seasonality, stationarity) for this.
We just want to feed our time-series data (with proper labels) into some kind of supervised ‘learning’ machine that can learn these categories (high or low variance, too few or too many anomalies, etc.) from the raw data.
A helpful Python library
Why don’t we take advantage of a Python library which can do this kind of classification for us automatically and all we have to do is to throw the data into it using standard Numpy/Pandas format?
Even better if that library has the looks and feels of our favorite Scikit-learn package!
We find such features in the beautiful library — tslearn. Put it simply, it is a Python package that provides machine learning tools for the analysis of time series. This package builds on (and hence depends on) scikit-learn, numpy and scipy libraries.

Image source: tslearn documentation
Why (and how) Synthetic Data?
As I wrote in this article — “ a synthetic dataset is a repository of data that is generated programmatically. So, it is not collected by any real-life survey or experiment. Its main purpose, therefore, is to be flexible and rich enough to help an ML practitioner conduct fascinating experiments with various classification, regression, and clustering algorithms.”
Synthetic data generation — a must-have skill for new data scientists
…and then extended the argument in this article — “Synthetic time-series is no exception — it helps a data scientist to experiment with various algorithmic methods and to prepare for real-life deployment in ways that could not have been possible with only real datasets.”
Create synthetic time-series with anomaly signatures in Python
Basically, we want to synthesize time-series data with anomalies and other patterns, automatically label them, and feed them to the tslearn algorithms for teaching our AI agent about these patterns.
In particular, if we want to use deep-learning-based classifiers (as offered by tslearn), then we may need a significant amount of data covering all possible variations, which may not be available readily in real-life situations. This is where synthetic data comes in handy.
Off to the adventure then!
Teaching the AI agent about time-series patterns
The demo notebook can be found here in my Github repo. The process of converting time-series data to a format suitable for training by a tslearn model is rather simple and is illustrated in the notebook. Here, we mainly focus on the various types of classification results as illustrations.
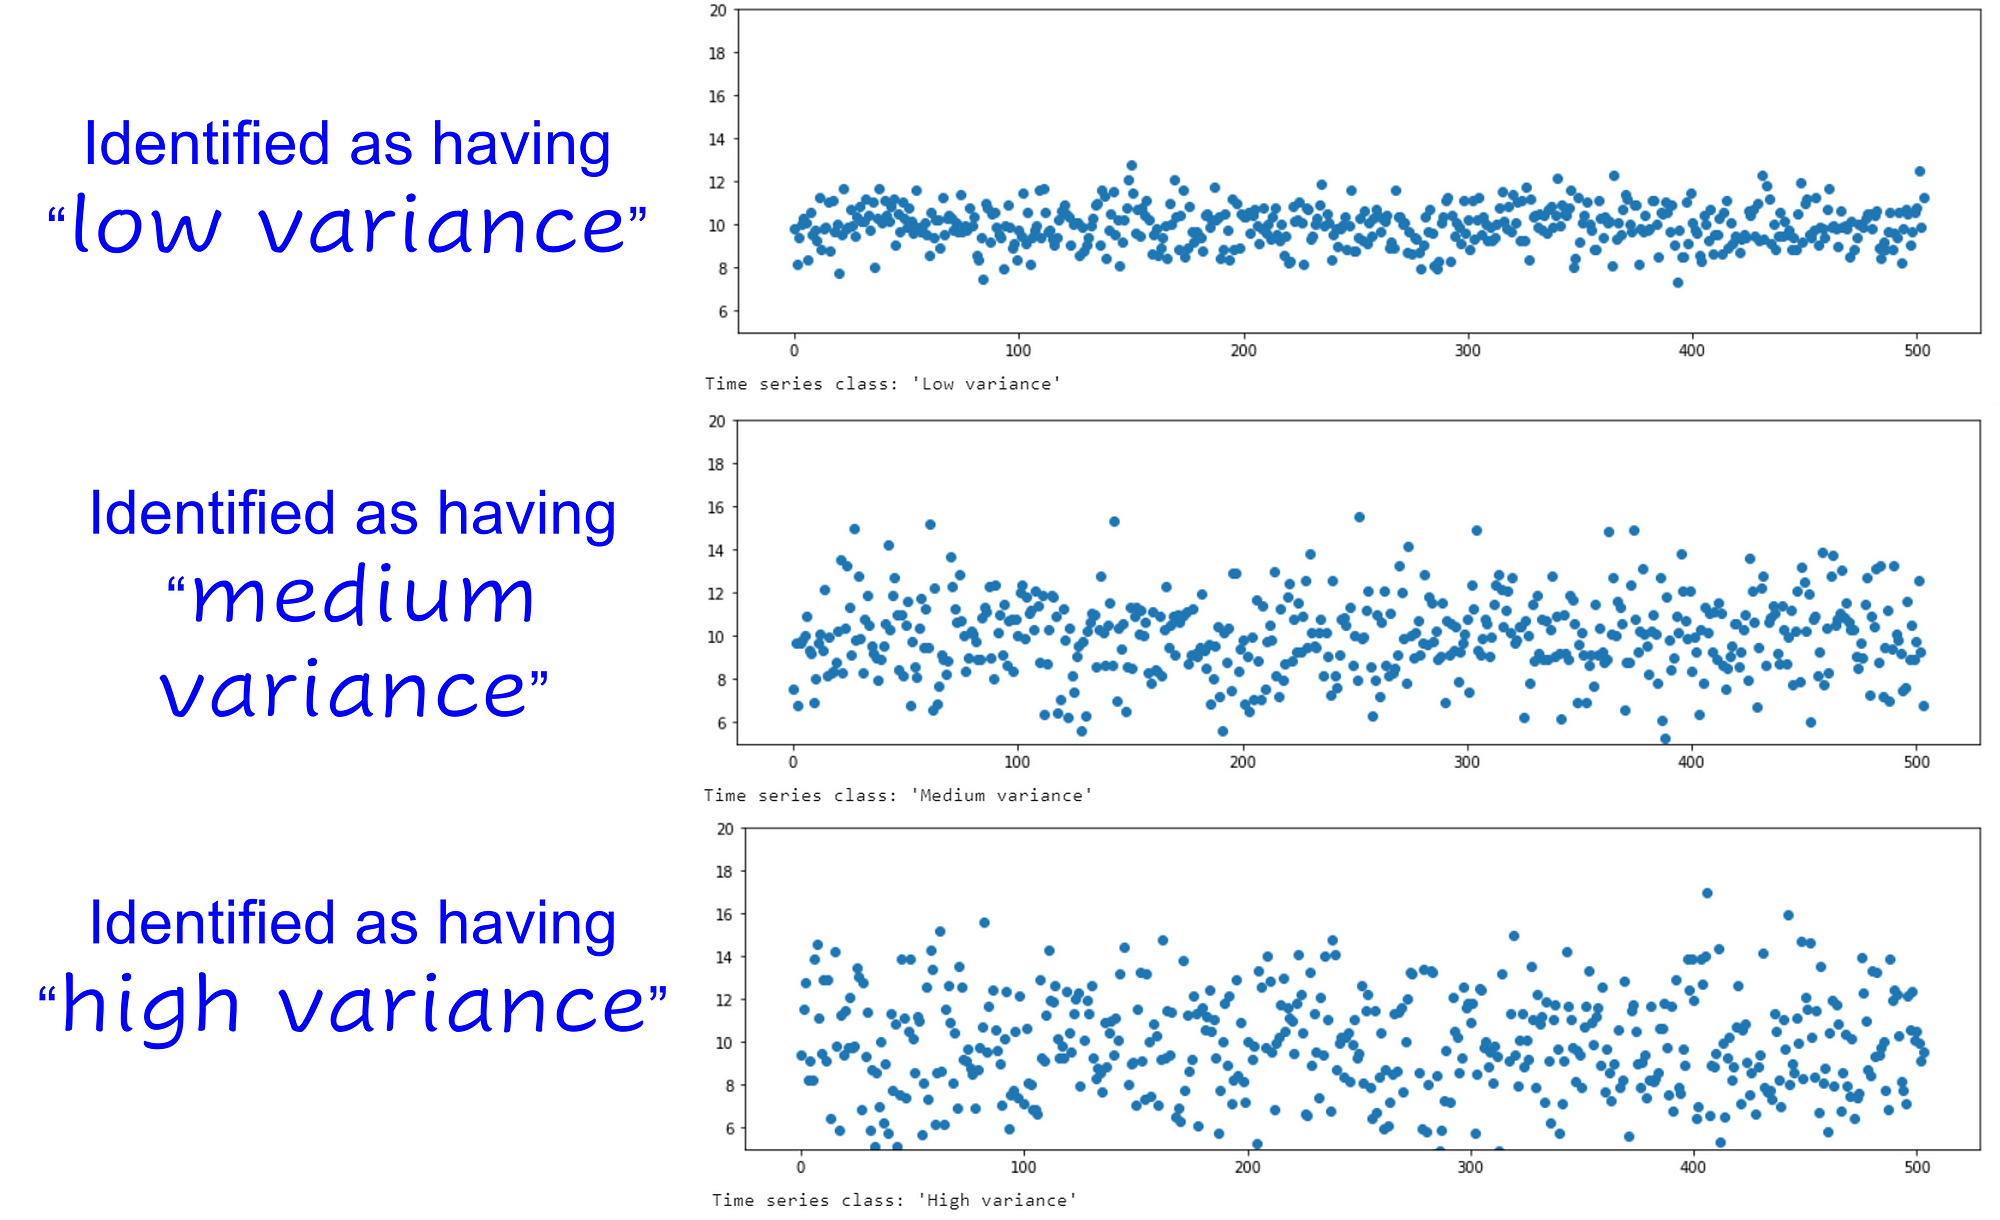
High or low variance in the data?
I deal with a lot of industrial data i.e. where an army of sensors are creating a never-ending stream of digital data from machines, factories, operators, and business processes.
Detecting whether a time-series data stream has high or low variance can be critical for many process decisions downstream. So, we start there.
The flow is simple,
- generate synthetic data using
SyntheticTSmodule (discussed in my article here and can be found here) - generate corresponding class labels to match these Numpy/Pandas data series (Note the auto-generation of labels based on domain knowledge injection)
- convert the synthetic series data to
tslearntime-series objects(arrays) - store them in the training dataset
- feed the training data to a suitable time-series classifier from
tslearn. We chose theTimeSeriesMLPClassifiermethod which is built atop the familiar multi-layer perceptron method of Scikit-learn essentially implementing a fully connected deep learning network.

Training flow with Synthetic data, Source: Prepared entirely by the author
The TimeSeriesMLPClassifier has all the bells and whistles of the standard Scikit-learn MLP classifier,
- hidden layer size and number of neurons
- activation function
- solver/optimizer (e.g. ‘Adam’)
- learning rate
- batch size
- tolerance
- momentum settings
- early stopping criterion

Basically, we want to synthesize time-series data with anomalies and other patterns, automatically label them, and feed them to the
tslearnalgorithms for teaching our AI agent about these patterns.
For brevity, in the notebook, I do not show the train/test split but that must be done as a standard data science workflow practice for real applications.
We can plot the standard loss curve after training and do all sorts of hyperparameter tuning to make the performance top-notch.
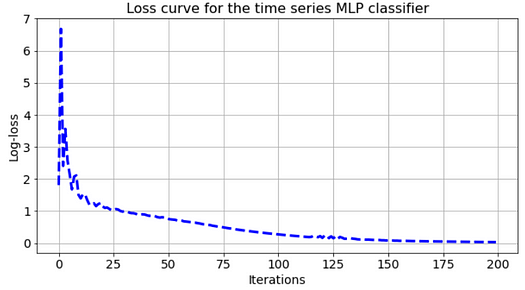
However, showing the deep learning classifier tuning is not the goal of this article. We would rather focus on the end results i.e. what kind of classification decisions it made.
Here are some random test results.
Label generation — manual or automatic?
The entire point of the article was to show that one can avoid manual labeling by synthetic data.
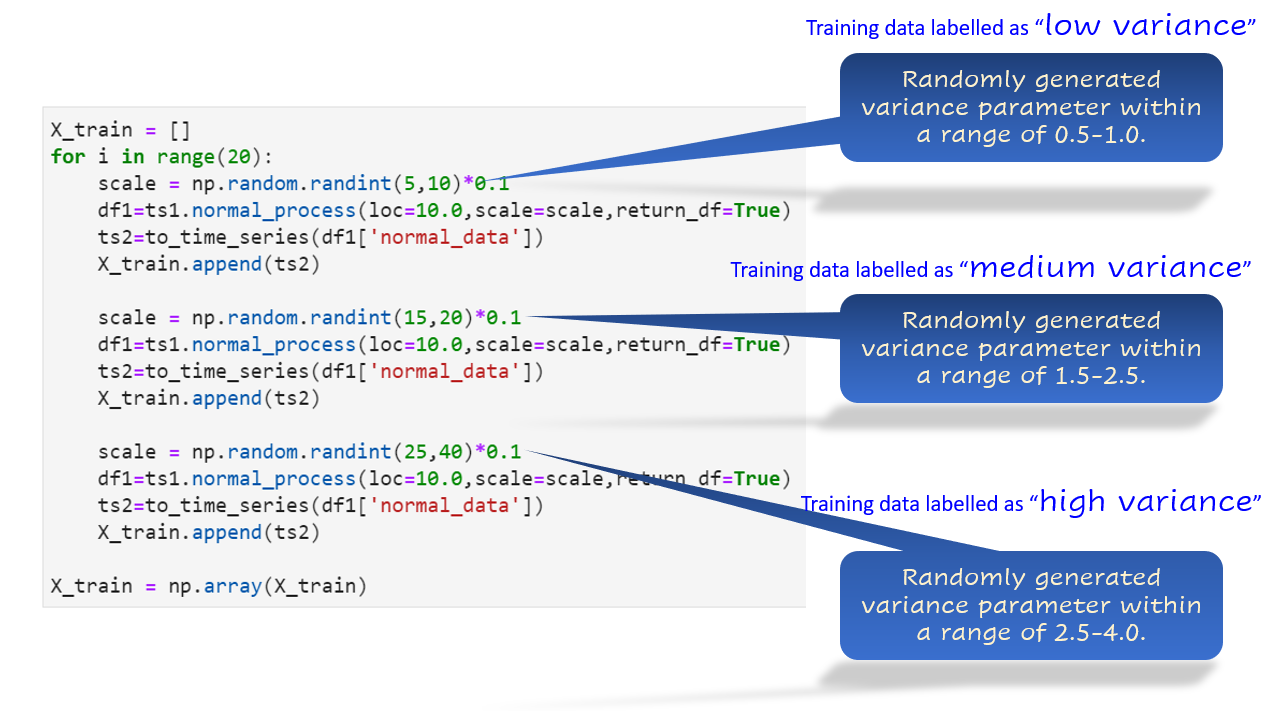
I generated hundreds of synthetic time series with random variances or shifts to train the classifier. Because they were generated programmatically, they could be labeled automatically too.
This point will be clear once you see the generation code in the actual Notebook. Here is the idea for the variance training.
Anomalies — high or low fractions of data?
Identifying anomalies is not enough. In most real-life situations, you have to also identify their frequency and occurrence pattern.
This is because industrial data analytics systems are often responsible for generating alerts once they detect sufficient anomalies in the data stream. Consequently, to decide whether to raise an alert or not, they need to have a good idea about whether the anomaly count represents a significant fraction of the normal data or not.
You don’t want to raise too many false alerts, do you? That will be bad for the reputation of an AI-driven system.
So, we went through the same process of training an AI model about the fraction of anomalies in time series data. Here are the random test results,

Anomalies — how big are they in magnitude?
In many cases, we are also interested in classifying the incoming data as having a high/medium/low magnitude of anomalies. For industrial data analytics, this feature may give an indication of the state of the machine or process abnormality.
We followed the same training process as above and obtained these results,

Data drifts or shifts — where and how?
Another classic operation in industrial data analytics is the detect the drift/ shift in the incoming sensor data from a machine. There could be a multitude of reasons,
- the machine may be agings,
- a process recipe/setting is changed suddenly without proper logging,
- a small sub-component may be degrading over time
Bottom line is that an AI-driven system should be able to identify these categories — at least in terms of positive or negative shifts and their point of occurrence i.e. whether the drift started early or late in the process lifecycle.
Identifying anomalies is not enough. In most real-life situations, you have to also identify their frequency and occurrence pattern. This is because industrial data analytics systems are often responsible for generating alerts once they detect sufficient anomalies in the data stream
In this case, we added the location of the shift (early or late in the whole time period) to the mix. So, we have the following classes to train the data on,
- early positive shift
- late positive shift
- early negative shift
- late negative shift
Because of this increased complexity, we needed to generate a larger amount of synthetic data than the previous experiments. Here are the results,

Summary
Time-series classification is a highly interesting topic for many wonderful use cases. In this article, we showed, how using synthetic data, we can train AI models (deep learning networks with a few fully connected layers) for one-dimensional time-series data mimicking industrial processes or sensor streams.
In particular, we focused on teaching the AI model about various anomaly properties and data drift patterns as these classifications are highly important indicators of machine degradation. In short, they form the bedrock of the so-called predictive analytics in the realm of Industry 4.0 or Smart Manufacturing.
We hope that the use of synthetic data for AI-driven predictive analytics will grow significantly in the future.
You can check the author’s GitHub repositories for code, ideas, and resources in machine learning and data science. If you are, like me, passionate about AI/machine learning/data science, please feel free to add me on LinkedIn or follow me on Twitter.
Bio: Tirthajyoti Sarkar is a Data Science/ML Manager at Adapdix Corp. He contributes regularly to publications such as KDnuggets and TDS on diverse topics related to data science and machine learning. He has authored data science books and contributes to open source software. Tirthajyoti holds a Ph.D. in EE and is working on an M.S. degree in Computational Data Analytics. Email him at tirthajyoti at gmail[dot]com.
Original. Reposted with permission.
Related:
- GPU-Powered Data Science (NOT Deep Learning) with RAPIDS
- Why and how should you learn “Productive Data Science”?
- Monte Carlo integration in Python