
15 Python Coding Interview Questions You Must Know For Data Science
Solving the Python coding interview questions is the best way to get ready for an interview. That’s why we’ll lead you through 15 examples and five concepts these questions cover.

Knowing Python is one of the crucial skills every data scientist should hone. And it’s not without reason. Python’s ability, combined with Pandas library, to manipulate and analyze data in a number of different ways makes it an ideal tool for a data science job.
It comes as no surprise that all the companies looking for data scientists will test their Python skills on a job interview.
We’ll have a look at what technical concepts, along with Python/Pandas functions, you should be familiar with to land a data science job.
These are the five topics we’ll talk about:
- Aggregation, Grouping, and Ordering Data
- Joining Tables
- Filtering Data
- Text Manipulation
- Datetime Manipulation
It goes without saying that these concepts are rarely tested separately, so by solving one question you’ll have to showcase your knowledge of multiple Python topics.
Aggregation, Grouping & Ordering Data

These three technical topics often come all together and they are fundamental to creating reports and doing any kind of data analysis.
They allow you to perform some mathematical operations and present your findings in a representable and user-friendly way.
We'll show you several practical examples to ensure you know what we’re talking about.
Python Coding Interview Question #1: Class Performance
This Box interview question asks you:
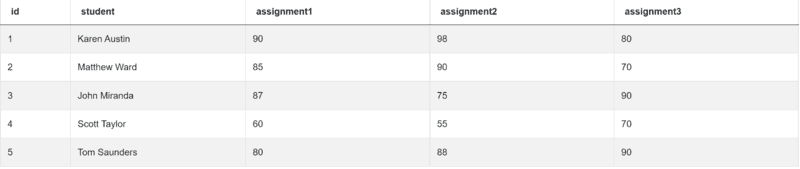
“You are given a table containing assignment scores of students in a class. Write a query that identifies the largest difference in total score of all assignments. Output just the difference in total score between the two students.”
Link to the question: https://platform.stratascratch.com/coding/10310-class-performance?python=1
Table you need to use is box_scores, which has the following columns:
| id | int64 |
| student | object |
| assignment1 | int64 |
| assignment2 | int64 |
| assignment3 | int64 |
Data from the table look like this:
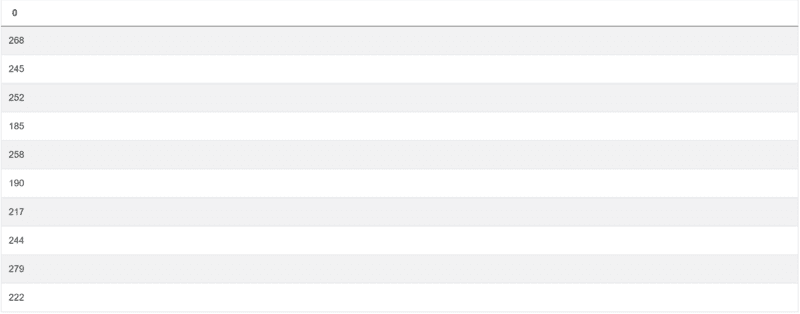
As a first step towards answering the question, you should sum the scores from all assignments:
import pandas as pd
import numpy as np
box_scores['total_score'] = box_scores['assignment1']+box_scores['assignment2']+box_scores['assignment3']
This part of the code will give you this:
Now that you know that, the next step is to find the largest difference between the total scores. You need to use the max() and min() functions to do that. Or, to be more specific, a difference between these two functions’ output. Add this to the above code, and you’ve got a final answer:
import pandas as pd
import numpy as np
box_scores['total_score'] = box_scores['assignment1']+box_scores['assignment2']+box_scores['assignment3']
box_scores['total_score'].max() - box_scores['total_score'].min()
This is the output you’re looking for:
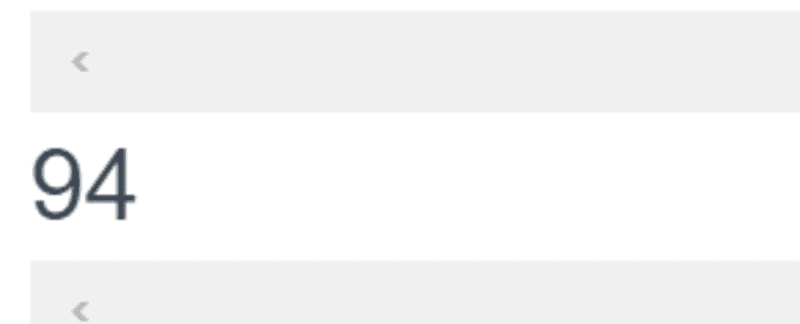
The question asked to output only this difference, so no other columns are needed.
Python Coding Interview Question #2: Inspection Scores For Businesses
The previous question didn’t require any data grouping and ordering, unlike the following question by the City of San Francisco:
Here’s a question by the City of San Francisco:
“Find the median inspection score of each business and output the result along with the business name. Order records based on the inspection score in descending order. Try to come up with your own precise median calculation. In Postgres there is `percentile_disc` function available, however it's only approximation.”
Link to the question: https://platform.stratascratch.com/coding/9741-inspection-scores-for-businesses?python=1
Here, you should use the notnull() function to make sure you get only businesses that have the inspection score. Additionally, you have to group data on business_name and calculate the median for the inspection_score. Use the median() function. Also, use the sort_values() to sort the output in descending order.
Python Coding Interview Question #3: Number Of Records By Variety
Take a look at this Microsoft question:
“Find the total number of records that belong to each variety in the dataset. Output the variety along with the corresponding number of records. Order records by the variety in ascending order.”
Link to the question: https://platform.stratascratch.com/coding/10168-number-of-records-by-variety?python=1
This shouldn’t be hard to solve after the first two examples. First, you should group by the columns variety and sepal_length. To find the number of records per variety, use the count() function. Finally, use the sort_values to sort by variety in alphabetical order.
Joining Tables
In all the previous examples, we were given only one table. We selected these examples, so it’s easier for you to understand how aggregation, grouping, and ordering data in Python work.
However, as a data scientist, you’ll more often than not have to know how to write a query that pulls data from several tables.
Python Coding Interview Question #4: Lowest Priced Orders
One of the easiest ways to join two tables in Python is by using the merge() function. We’ll do that to solve the Amazon question:
“Find the lowest order cost of each customer. Output the customer id along with the first name and the lowest order price.”
Link to the question: https://platform.stratascratch.com/coding/9912-lowest-priced-orders?python=1
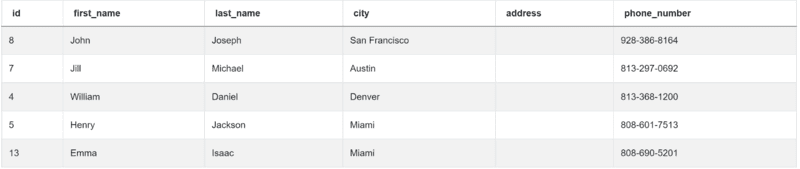
You’re given two tables to work with. The first table is customers:
| id | int64 |
| first_name | object |
| last_name | object |
| city | object |
| address | object |
| phone_number | object |
Here’s the data:
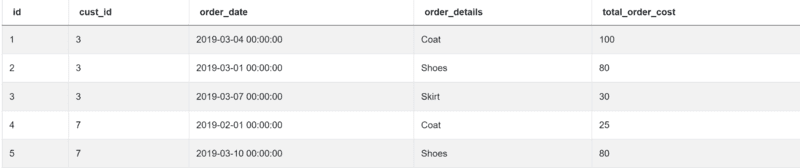
The second table is named orders with the following columns:
| id | int64 |
| cust_id | int64 |
| order_date | datetime64[ns] |
| order_details | object |
| total_order_cost | int64 |
And the data is:
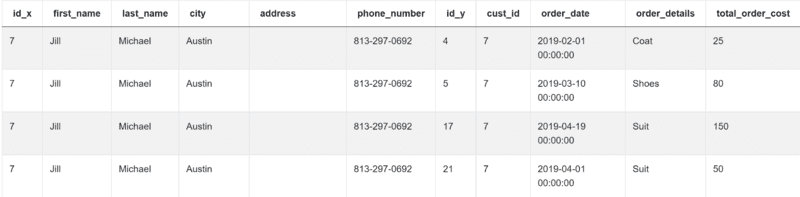
Since you need the data from both tables, you’ll have to merge or inner join them:
import pandas as pd
import numpy as np
merge = pd.merge(customers, orders, left_on="id", right_on="cust_id")
You do that on the column id from the table customers, and the column cust_id from the table orders. The result shows two tables as one:
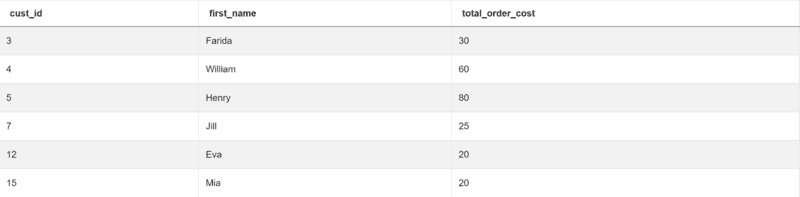
Once you’ve done that, use the groupby() function to group the output by cust_id and first_name. These are the columns the question asks you to show. You need to show the lowest order cost for each customer, too. You do that using the min() function.
The complete answer is thus:
import pandas as pd
import numpy as np
merge = pd.merge(customers, orders, left_on="id", right_on="cust_id")
result = merge.groupby(["cust_id", "first_name"])["total_order_cost"].min().reset_index()
This code returns the desired output.
Python Coding Interview Question #5: Income By Title and Gender
Here, we have another question from the City of San Francisco:
“Find the average total compensation based on employee titles and gender. Total compensation is calculated by adding both the salary and bonus of each employee.
However, not every employee receives a bonus so disregard employees without bonuses in your calculation. Employee can receive more than one bonus.
Output the employee title, gender (i.e., sex), along with the average total compensation.”
Link to the question: https://platform.stratascratch.com/coding/10077-income-by-title-and-gender?python=1
When answering this question, the first step should be to group by worker and bonus while using the sum() function to get the bonus per worker id. Then you should merge the tables you have at your disposal. This is again an inner join. Once you do that, you can get the total compensation by adding salary and bonus. The last step is to output the employee title, gender, and average total compensation, which you get by using the mean() function.
Python Coding Interview Question #6: Product Transaction Count
Here’s a question by Microsoft:
“Find the number of transactions that occurred for each product. Output the product name along with the corresponding number of transactions and order records by the product id in ascending order. You can ignore products without transactions.”
Link to the question: https://platform.stratascratch.com/coding/10163-product-transaction-count?python=1
Here are some tips on writing a code. First, you should use the notnull() function to get the products with at least one transaction. Next, inner join this table with the table excel_sql_inventory_data using the merge() function. Use groupby() and transform() to get the number of transactions. Then get rid of the duplicate products and show the number of transactions for every product. Finally, sort the output by the product_id.
Data Filtering

When you use Python, you’ll usually use it on huge amounts of data. However, you won’t be required to output all data because that is simply pointless.
Analyzing data also includes setting certain criteria to pull only data you want to see in your output. For that, you should use certain ways of filtering data.
While merge() also filters data in a way, here we’re talking about using the comparison operators (==, <, >, <=, >=), between(), or some other ways to limit the number of rows in the output. Let’s see how this is done in Python!
Python Coding Interview Question #7: Find the Top 10 Ranked Songs in 2010
This is a question you could be asked at the Spotify interview:
“What were the top 10 ranked songs in 2010? Output the rank, group name, and song name but do not show the same song twice. Sort the result based on the year_rank in ascending order.”
Link to the question: https://platform.stratascratch.com/coding/9650-find-the-top-10-ranked-songs-in-2010?python=1
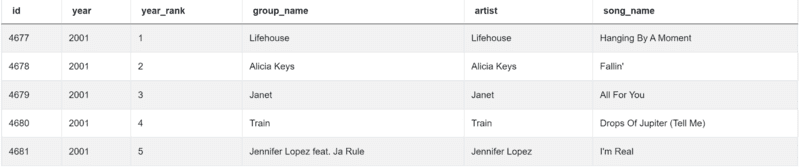
To solve the problem, you need only the table billboard_top_100_year_end:
| id | int64 |
| year | int64 |
| year_rank | int64 |
| group_name | object |
| artist | object |
| song_name | object |
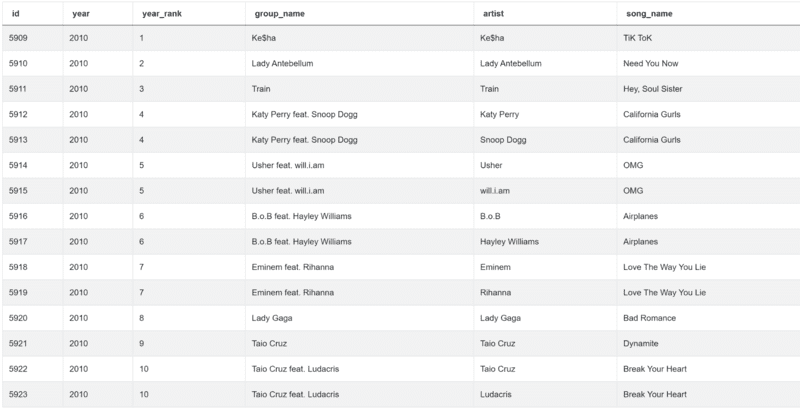
The data from the table looks like this:
Here’s how we approach answering the question.
import pandas as pd
import numpy as np
conditions = billboard_top_100_year_end[(billboard_top_100_year_end['year'] == 2010) & (billboard_top_100_year_end['year_rank'].between(1,10))]
The above code sets up two conditions. The first one is using the ‘==’ operator. By using it, we select only songs appearing in 2010. The second condition selects only songs that had a ranking between 1 and 10.
Running this code returns:
After that, we need to select only three columns: year_rank, group_name, and song_name. We will also remove duplicates using the drop_duplicates() function.
That makes the code complete:
import pandas as pd
import numpy as np
conditions = billboard_top_100_year_end[(billboard_top_100_year_end['year'] == 2010) & (billboard_top_100_year_end['year_rank'].between(1,10))]
result = conditions[['year_rank','group_name','song_name']].drop_duplicates()
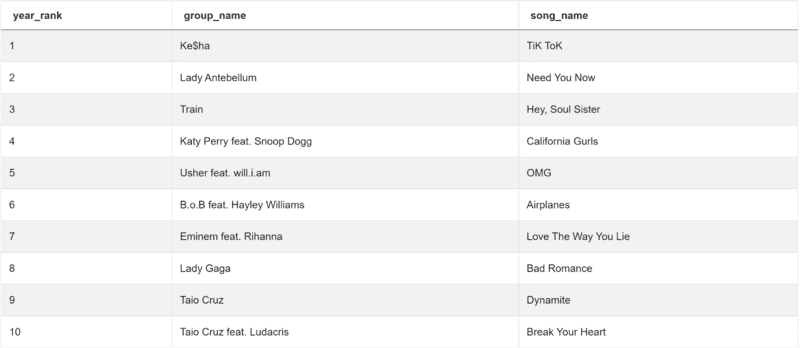
It will give you the top 10 ranked songs in 2010:
Python Coding Interview Question #8: Apartments in New York City and Harlem
Try and solve the question by Airbnb:
“Find the search details of 50 apartment searches the Harlem neighborhood of New York City.”
Link to the question: https://platform.stratascratch.com/coding/9616-apartments-in-new-york-city-and-harlem?python=1
Here are some hints. You need to set three conditions that will get you only apartment category, only those in Harlem, and the city has to be NYC. All three conditions will be set using the ‘==’ operator. You don’t need to show all apartments, so use the head() function to limit the number of rows in the output.
Python Coding Interview Question #9: Duplicate Emails
The last question focused on filtering data is by Salesforce:
“Find all emails with duplicates.”
Link to the question: https://platform.stratascratch.com/coding/9895-duplicate-emails?python=1
This question is rather simple. You need to use the groupby() function to group by email and find how many times each email address appears. Then use the ‘>’ operator on the number of email addresses to get duplicates.
Manipulating Text
When working with data, you’ll have to manipulate it to make it more suitable for your analysis. This is often the case with text data. It includes allocating new values to data according to the text stored, parsing and merging text, or finding its length, position of a certain letter, sign, etc.
Python Coding Interview Question #10: Reviews Bins on Reviews Number
The next question is by Airbnb:
“To better understand the effect of the review count on the price of accommodation, categorize the number of reviews into the following groups along with the price.
0 reviews: NO
1 to 5 reviews: FEW
6 to 15 reviews: SOME
16 to 40 reviews: MANY
more than 40 reviews: A LOT
Output the price and its categorization. Perform the categorization on accommodation level.“
Link to the question: https://platform.stratascratch.com/coding/9628-reviews-bins-on-reviews-number?python=1
You’re working with only one table, but the one with quite a lot of columns. The table is airbnb_search_details, and the columns are:
| id | int64 |
| price | float64 |
| property_type | object |
| room_type | object |
| amenities | object |
| accommodates | int64 |
| bathrooms | int64 |
| bed_type | object |
| cancellation_policy | object |
| cleaning_fee | bool |
| city | object |
| host_identity_verified | object |
| host_response_rate | object |
| host_since | datetime64[ns] |
| neighbourhood | object |
| number_of_reviews | int64 |
| review_scores_rating | float64 |
| zipcode | int64 |
| bedrooms | int64 |
| beds | int64 |
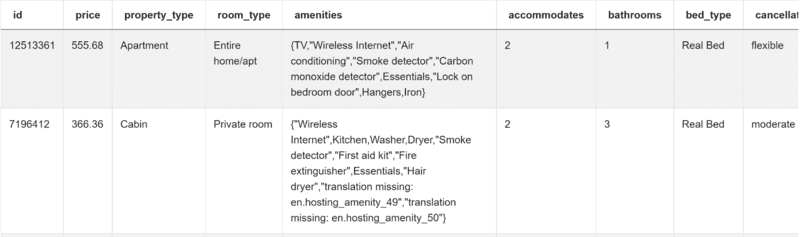
Here are several first rows from the table:
The first step in writing the code should be getting the number of reviews.
import pandas as pd
import numpy as np
num_reviews = airbnb_search_details['number_of_reviews']
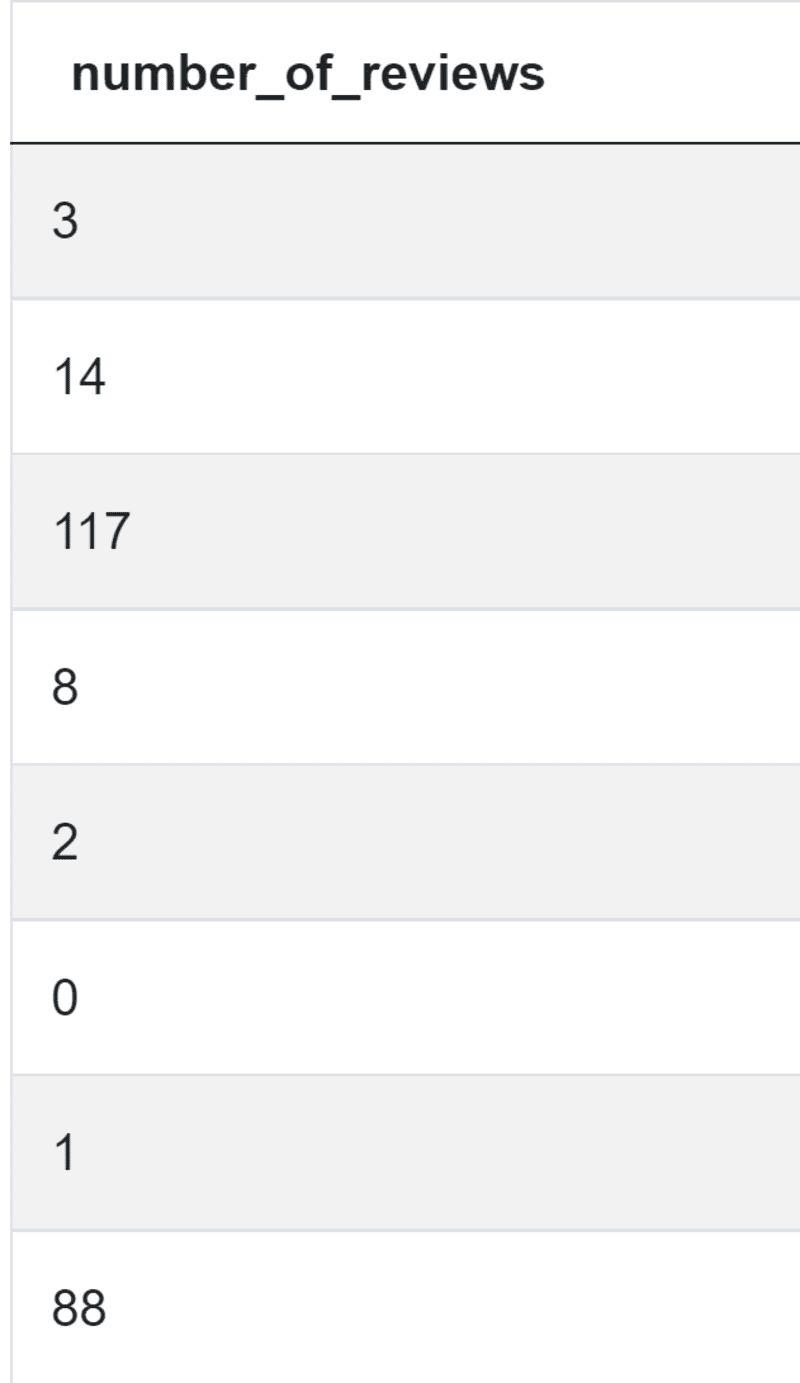
You get this:
Next, you’d want to get the accommodation with 0 reviews, then with 1-5, 6-15, 16-40, and more than 40 reviews. To get that, you’ll need the combination of the ‘==’ and ‘>’ operators, and the between() function.
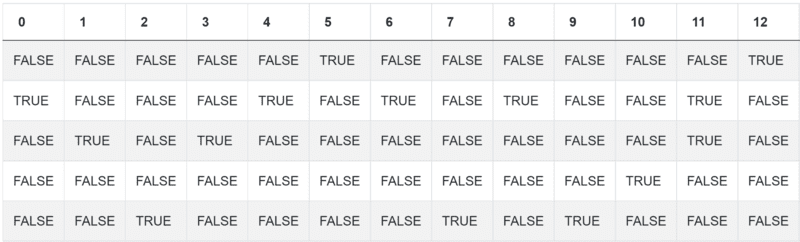
import pandas as pd
import numpy as np
num_reviews = airbnb_search_details['number_of_reviews']
condlist = [num_reviews == 0, num_reviews.between(1,5),num_reviews.between(5,15),num_reviews.between(15,40),num_reviews>40]
Here’s what your current output should look like:
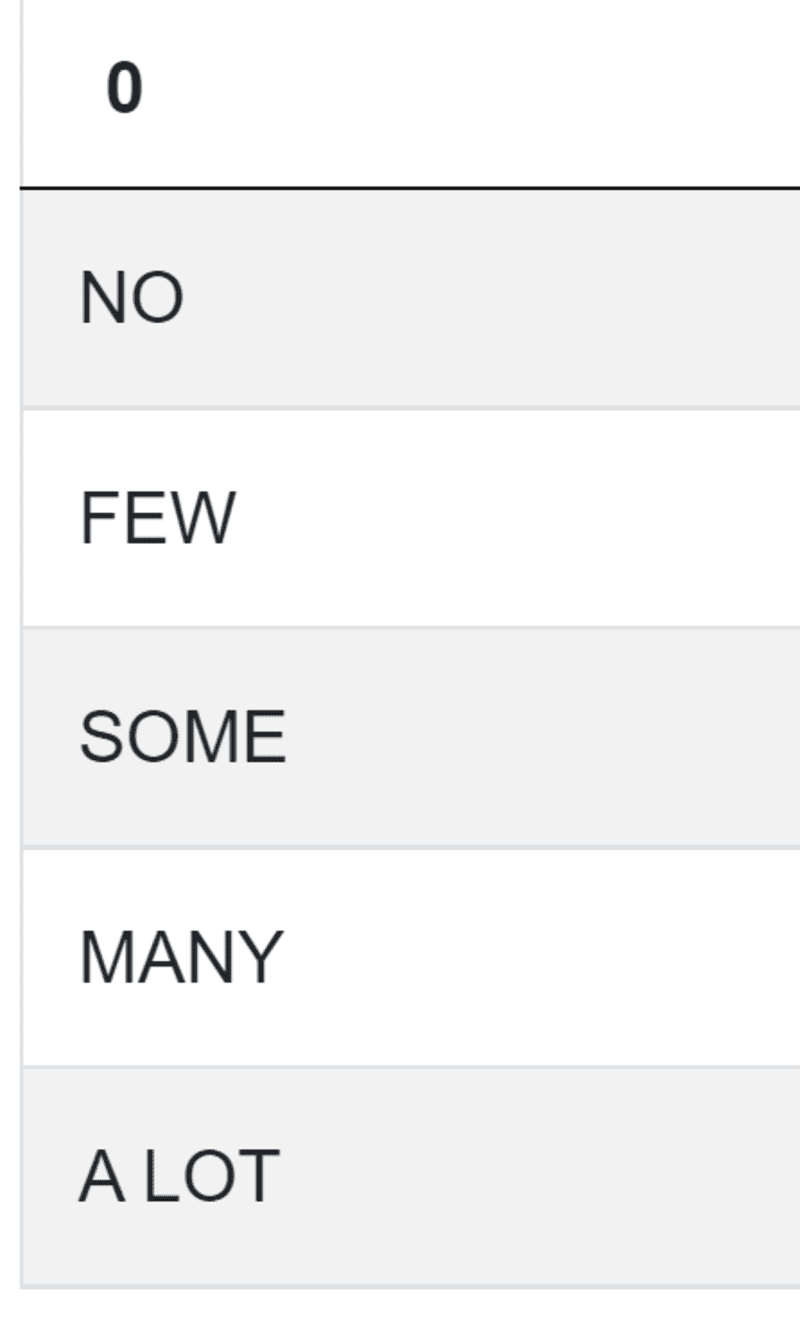
Now comes working with text in the shape of assigning the categories. And these are: NO, FEW, SOME, MANY, A LOT. Your code up until now is:
import pandas as pd
import numpy as np
num_reviews = airbnb_search_details['number_of_reviews']
condlist = [num_reviews == 0, num_reviews.between(1,5),num_reviews.between(5,15),num_reviews.between(15,40),num_reviews>40]
choicelist = ['NO','FEW','SOME','MANY','A LOT']
OK, here are your categories:
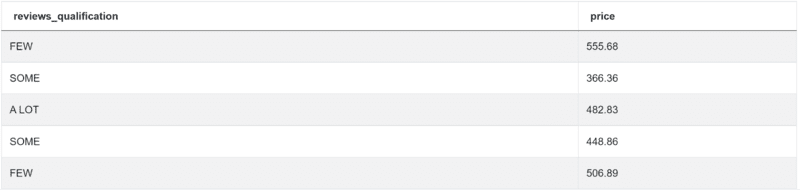
The final step is to allocate these categories to the accommodation and list its price:
import pandas as pd
import numpy as np
num_reviews = airbnb_search_details['number_of_reviews']
condlist = [num_reviews == 0, num_reviews.between(1,5),num_reviews.between(5,15),num_reviews.between(15,40),num_reviews>40]
choicelist = ['NO','FEW','SOME','MANY','A LOT']
airbnb_search_details['reviews_qualification'] = np.select(condlist,choicelist)
result = airbnb_search_details[['reviews_qualification','price']]
This code will get you the desired output:
Python Coding Interview Question #11: Business Name Lengths
The next question is by the City of San Francisco:
“Find the number of words in each business name. Avoid counting special symbols as words (e.g. &). Output the business name and its count of words.”
Link to the question: https://platform.stratascratch.com/coding/10131-business-name-lengths?python=1
When answering the question, you should first find only distinct businesses using the drop_duplicates() function. Then use the replace() function to replace all the special symbols with blank, so you don’t count them later. Use the split() function to split the text into a list, and then use the len() function to count the number of words.
Python Coding Interview Question #12: Positions Of Letter 'a'
This question by Amazon asks you to:
“Find the position of the letter 'a' in the first name of the worker 'Amitah'. Use 1-based indexing, e.g. position of the second letter is 2.”
Link to the question: https://platform.stratascratch.com/coding/9829-positions-of-letter-a?python=1
There are two main concepts in the solution. The first is filtering the worker ‘Amitah’ using the ‘==’ operator. The second one is using the find() function on a string to get the position of the letter ‘a’.
Manipulating Datetime

As a data scientist, you’ll be working with dates a lot. Depending on the data available, you could be asked to convert data to datetime, extract a certain period of time (such as month or year), or manipulate datetime in any other way that’s suitable.
Python Coding Interview Question #13: Number of Comments Per User in Past 30 days
Here’s a question by Meta/Facebook:
“Return the total number of comments received for each user in the last 30 days. Don't output users who haven't received any comment in the defined time period. Assume today is 2020-02-10.”
Link to the question: https://platform.stratascratch.com/coding/2004-number-of-comments-per-user-in-past-30-days?python=1
You can find data in the table fb_comments_count:
| user_id | int64 |
| created_at | datetime64[ns] |
| number_of_comments | int64 |
Data is here, too:
Have a look at the solution, and then we’ll explain it below:
import pandas as pd
from datetime import timedelta
result = fb_comments_count[(fb_comments_count['created_at'] >= pd.to_datetime('2020-02-10') - timedelta(days=30)) & (
fb_comments_count['created_at'] <= pd.to_datetime('2020-02-10'))].groupby('user_id')[
'number_of_comments'].sum().reset_index()
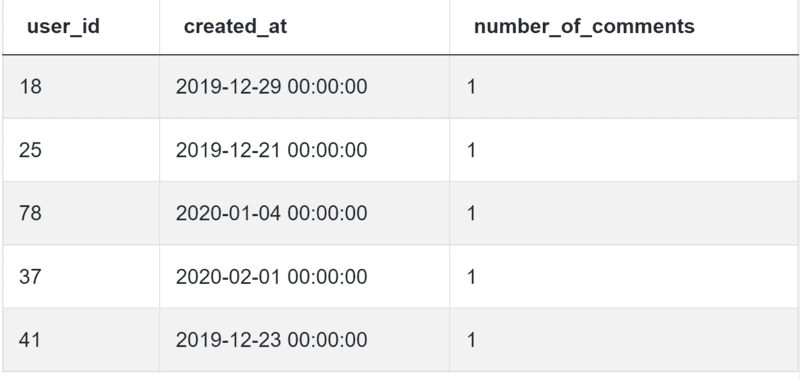
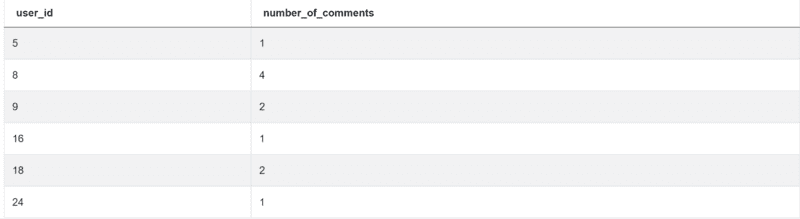
To find the comments not older than thirty days from 2020-02-10, you first need to convert this date to datetime using the to_datetime() function. To get the latest date of the comments you’re interested in, subtract 30 days from today using the timedelta() function. All the comments you’re interested in have date equal to or greater than this difference. Also, you want to exclude all the comments that are posted after 2020-02-10. That’s why there’s a second condition. Finally, group by the user_id and use the sum() function to get the comments per user.
If you did everything right, you’d get this output:
Python Coding Interview Question #14: Finding User Purchases
This is the question by Amazon:
“Write a query that'll identify returning active users. A returning active user is a user that has made a second purchase within 7 days of any other of their purchases. Output a list of user_ids of these returning active users.”
Link to the question: https://platform.stratascratch.com/coding/10322-finding-user-purchases?python=1
To solve it, you need to use the strftime() function to get the date of purchase in an MM-DD-YYYY format. Then use the sort_values() to sort the output in ascending order according to the user’s ID and the date of purchase. To get the previous order, apply the shift() function, group by the user_id, and show the purchase dates.
Use the to_datetime to convert the order’s and the previous order’s date, and then find the difference between the two dates. Finally, filter the result so it outputs only users with seven days or less between the first and the second purchase, and use the unique() function to get only the distinct users.
Python Coding Interview Question #15: Customer Revenue In March
The last question is by Meta/Facebook:
“Calculate the total revenue from each customer in March 2019. Include only customers who were active in March 2019.
Output the revenue along with the customer id and sort the results based on the revenue in descending order.”
Link to the question: https://platform.stratascratch.com/coding/9782-customer-revenue-in-march?python=1
You’ll need to_datetime() on the column order_date. Then extract March and the year 2019 from the same column. Finally, group by the cust_id and sum the column total_order_cost, which will be the revenue you’re looking for. Use the sort_values() to sort the output according to revenue in descending order.
Conclusion
By showing you 15 interview questions from top companies, we covered five main topics interviewers are interested in when testing your Python skills.
We kicked off with aggregation, grouping, and ordering of data. Then we showed you how to join tables and filter your output. Finally, you learned how to manipulate text and datetime data.
These are not the only concepts you should know, of course. But it should give you a sound basis for interview preparation and answering some more python interview questions.
To practice more Python Pandas functions, check out our post “Python Pandas Interview Questions for Data Science” that will give you an overview of the data manipulation with Pandas and the types of Pandas questions asked in Data Science Interviews.
Nate Rosidi is a data scientist and in product strategy. He's also an adjunct professor teaching analytics, and is the founder of StrataScratch, a platform helping data scientists prepare for their interviews with real interview questions from top companies. Connect with him on Twitter: StrataScratch or LinkedIn.