10 Most Used Tableau Functions
Learn about the most used string, number, date, logical, and aggregation Tableau functions.
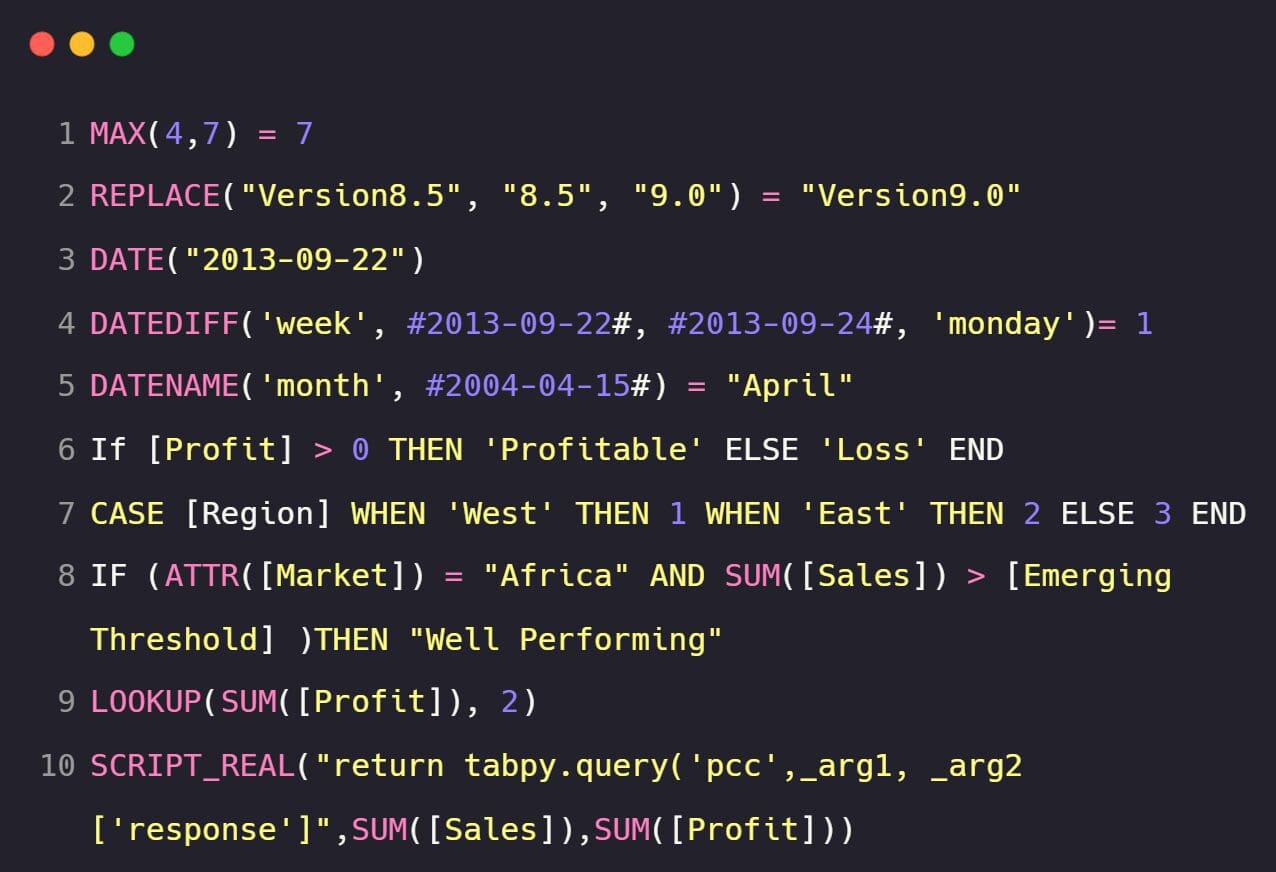
Image by Author | Carbon
Tableau Functions gives extra capabilities to business intelligence developers to drive complex analysis and perform mathematical calculation. It is used to augment string, numbers, date, and geographical data fields.
We will learn about the 10 most used Tableau functions for business intelligence testing and development. These functions will help you understand how Tableau is more than just a drag-and-drop fancy tool.
MIN and MAX
The MAX function will return the highest value of the two arguments. It can also be applied to data fields, as shown below.
MAX([Sales],[Profit])
Example:
MAX(10,17) = 17
For MIN, it is the opposite. The function will return the lowest value among the two arguments. The arguments can be data fields or integers.
MIN([Sales],[Profit])
Example:
MIN(14,17) = 14
REPLACE
The REPLACE function can be applied to string data fields and strings. It requires three arguments:
- string: it can be a string data field or string.
- substring: is the word or alphabet you want to change.
- replacement: a string that will replace a substring.
REPLACE(string, substring, replacement)
Example:
REPLACE("Abid Ali", "Ali", "Awan") = "Abid Awan"
DATEDIFF
It is used to find differences between two date fields. You can extract the difference of weeks, days, months, and years.
The function requires 4 arguments:
- date_part: is a date unit for returning the difference between two dates.
- date1 and date2: are the date fields
- start_of_week: it can be Monday, Sunday, or Tuesday. It all depends on your requirement.
DATEDIFF(date_part, date1, date2, [start_of_week])
Example:
DATEDIFF('week', #2019-10-22#, #2019-10-24#, 'monday')= 1
DATENAME and DATEPART
DATENAME is used to return date_part in a string of date data fields. We can extract the day, year, week, and month of a date.
- date_part: is a date unit applied on date
- date: is a date field or string.
- start_of_week: day is to be considered the first day of the week
DATENAME(date_part, date, [start_of_week])
Example:
DATENAME('month', #2020-03-25#) = "March"
Instead of returning the name of the month in strings, the DATEPART is used to extract the date part from a date in the form of an integer. We can use it to perform complex computations.
DATEPART(date_part, date, [start_of_week])
Example:
DATEPART('month', #2020-03-25#) = 3
Type Conversion
It is the most used function in Tableau, and I use it to convert strings to date, Integers to strings, strings to floats, and date parsing.
Here is the list of type conversion functions:
- DATE(expression)
- DATETIME(expression)
- DATEPARSE(format, string)
- FLOAT(expression)
- INT(expression)
- STR(expression)
IF and ELSE
Tableau has simple conditional functions. You can perform an If else statement like Python. Just make sure that you add “END” to close the statement.
I use IF & ELSE statements for creating categories and plotting time series graphs.
IF <expr> THEN <then> ELSE <else> END
Example:
If [Profit] > 0 THEN 'Profitable' ELSE 'Loss' END
AND and OR
For advanced logical functions, you can also add AND and OR commands to expand the expression.
IF <expr1> AND <expr2> THEN <then> END
Example:
IF (ATTR([Market]) = "South Asia" AND SUM([Sales]) > [Emerging Threshold] )THEN "Well Performing"
CASE
Similar to IF & ELSE statements, you can use CASE for creating logical functions. You can apply it to a data field and create multiple categories based on expressions.
CASE <expression> WHEN <value1> THEN <return1> WHEN <value2> THEN <return2> ... ELSE <default return> END
Example:
The script below is used to convert “Language” string field into integer. If the values are in English it will return 1, for Urdu 2, and for everything else 3.
CASE [Language] WHEN 'English' THEN 1 WHEN 'Urdu' THEN 2 ELSE 3 END
LOOKUP
LOOKUP is used to create offsets in the dataset. I mostly use this function to create time series forecasts and analytics.
It requires a data field and offset parameter in the form of an integer.
LOOKUP(expression, [offset])
Example:
By using the command below, we have offset the Profit by 2. Now, we can see sales value from 2 quarters into the future.
LOOKUP(SUM([Profit]), 2)
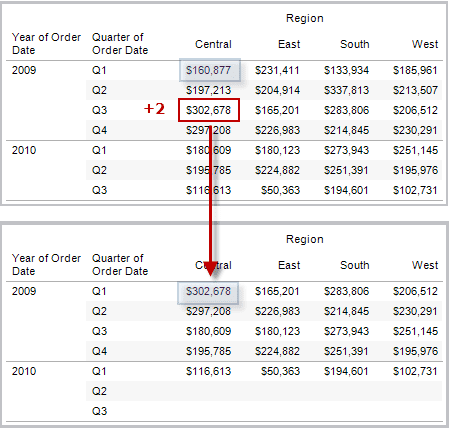
Image from Tableau
TabPy
TabPy allows users to run Python scripts within Tableau. You can install it using `pip install tabpy` and run the server by typing `tabpy` in the terminal. Learn more about Tabpy installation by following TabyPy Tutorial.
You can use:
- SCRIPT_BOOL
- SCRIPT_INT
- SCRIPT_REAL
- SCRIPT_STR
And each command requires Python scripts with placeholders for arguments and lists of arguments.
SCRIPT_REAL(Python Script, argument 1, argument 2, ...)
Example:
We are going to create a correlation function that takes Sales and Profit fields and returns the correlation coefficient. As you can see, the _arg1 and _arg2 are placeholders for Sales and Profit.
SCRIPT_REAL("import numpy as np

return np.corrcoef(_arg1,_arg2)[0,1]",

SUM([Sales]),SUM([Profit]))
Similarly, you can deploy the Python function to the TabPy server and access it using the same script. Read TabPy Tutorial: Deploying Python Functions and Prophet Forecasting Model to learn more about deploying Python functions.
The TabPy query script which starts with “return tabpy.query(<function name>, lists or arguments)[‘response’]”
SCRIPT_REAL(TabPy Query Script, argument 1, argument 2, ...)
Example:
We are accessing the Pearson Correlation Coefficient function by adding the function name (pcc), arguments placeholders, and arguments.
SCRIPT_REAL("return tabpy.query('pcc',_arg1, _arg2)['response']",

SUM([Sales]),SUM([Profit]))
Learn more about Tableau functions by reading the official documentation.
Abid Ali Awan (@1abidaliawan) is a certified data scientist professional who loves building machine learning models. Currently, he is focusing on content creation and writing technical blogs on machine learning and data science technologies. Abid holds a Master's degree in Technology Management and a bachelor's degree in Telecommunication Engineering. His vision is to build an AI product using a graph neural network for students struggling with mental illness.