Which Metric Should I Use? Accuracy vs. AUC
Depending on the problem you’re trying to solve, one metric may be more insightful than another.

Source
Accuracy and AUC (Area Under the Curve) are measures to evaluate the goodness of model performance. Both are helpful to gauge the model performance depending on the type of business problem you are trying to solve. So which one should you use and when? Well, the short answer is - It depends!
In this post, we will first describe both the metrics and then learn each of the metrics in detail and understand when to use them.
What is Accuracy?
Accuracy is the most popular metric that determines the percentage of correct predictions made by the model.
It is computed as a ratio of the number of true predictions with that of the total number of samples in the dataset. The resulting quantity is measured in percentage terms, for example, if the model correctly predicted 90% of the items in your dataset, it has 90% accuracy.
Mathematically it is written as:
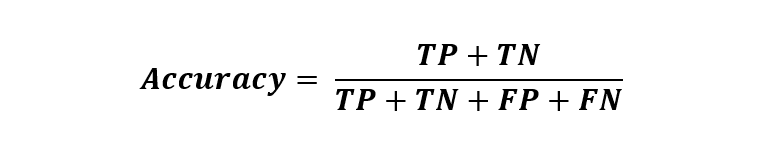
The four constituents in the formula are based on the actuals and corresponding model predictions defined below:
- True Positive (TP) - number of instances where the model correctly identifies a positive class.
- True Negative (TN) - number of instances where the model correctly identifies a negative class.
- False Positive (FP) - number of instances where the model incorrectly identifies a negative class.
- False Negative (FN) - number of instances where the model incorrectly identifies a positive class.
These metrics are derived by applying an appropriate cut-off to the predicted probability score of the model. A detailed explanation of each of the terms and their relationship with the confusion matrix is explained in this article.
What is AUC?
AUC stands for “Area Under the Curve” in general, and “Area under the Receiver Operating Characteristic Curve” in long form. It captures the area under the ROC (Receiver Operating Characteristic) curve and compares the relationship between the True Positive Rate (TPR) with that of the False Positive Rate (FPR) across different cut-off thresholds.
But before deep-diving into AUC, let's first understand what these new terms mean.
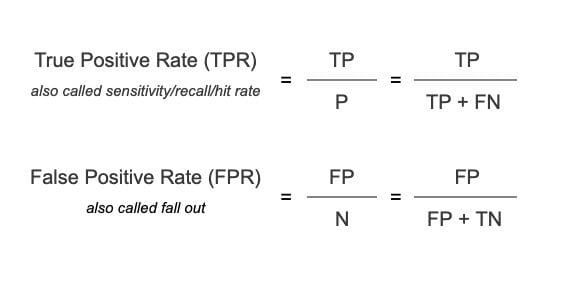
TPR or True Positive Rate
It is the ratio of correctly predicted positive instances out of all the positive samples. For example, if the model is tasked to identify the fraudulent transactions, then TPR is defined as the proportion of correctly predicted fraudulent transactions among all fraudulent transactions.
FPR or False Positive Rate
It is the percentage of incorrectly predicted negative cases. Continuing with the fraud detection model, the FPR is defined as the proportion of falsely predicted fraudulent alerts out of all the legitimate transactions.
Mathematically, TPR and FPR are expressed as:
Now that we understand TPR and FPR by definition, let's understand how they relate to the AUC metric.
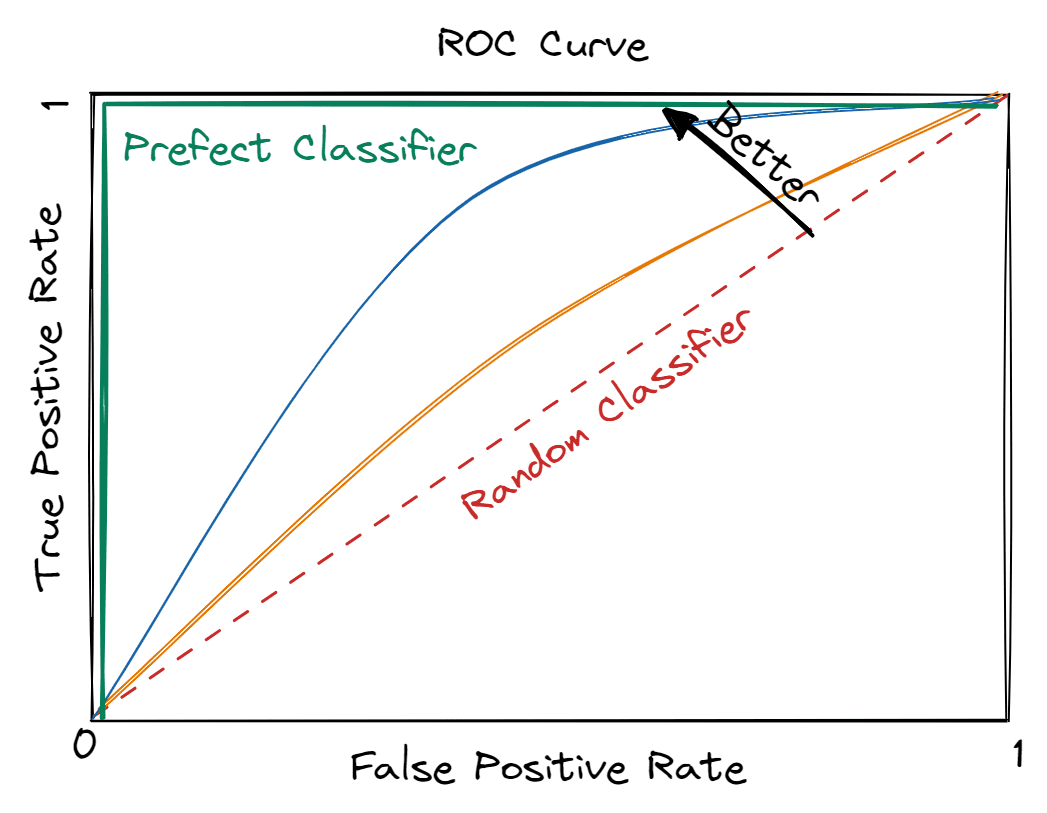
Image by Editor
As evident from the image above, the top left corner i.e. high TPs and low FPs is the desirable state. Thus, the purple color curve makes a perfect classifier with an AUC of 1 i.e. square area below this curve is 1.
But, constructing such an ideal classifier is not practically achievable in real-world applications. Hence, it is important to understand the lower bound of a classifier which is denoted by a red color diagonal line. It is annotated as a random classifier and has an AUC of 0.5 i.e. the area of a triangle below the red dotted line. It is called a random classifier because its predictions are as good as a random flip of a coin.
In summary, a machine learning model’s performance lies between a random classifier and the perfect classifier, which indicates that the expected AUC is bounded between 0.5 (random state) and 1 (perfect state).
Essentially, data scientists aim to maximize AUC i.e. larger area under the curve. It signifies the model's goodness in generating correct predictions aka striving for the highest TPR while maintaining the lowest possible FPR.
When to Use Accuracy?
Accuracy is used for balanced datasets i.e. when the classes are equally distributed.
A real-life example is fraud detection which must correctly identify and distinguish fraudulent transactions (class of interest) from regular transactions. Usually, fraudulent transactions are rare i.e. their occurrence in the training data set would be less than ~1%.
Accuracy in this case would be a biased representation of model performance and would declare the model good even if it identifies every transaction as non-fraudulent. Such a model would have high accuracy but fails to predict any fraudulent transaction, defeating the purpose of building the model.
When to Use AUC?
AUC is well-suited for imbalanced datasets. For example, the fraud detection model must correctly identify fraud even if it comes at the cost of flagging some (a small number) of the non-fraudulent transactions as fraudulent.
It is highly probable that while focusing on correctly identifying the class of interest (fraudulent transactions) i.e. the TPs, the model makes some mistakes i.e. FPs (marking non-fraudulent transactions as fraudulent). Thus it’s important to look at a measure that compares TPR and FPR. This is where AUC fits in.
Which One Should You Choose and When?
Accuracy and AUC are both used for classification models. However, there are a few things to keep in mind when you’re deciding which one to use.
A high accuracy model indicates very few incorrect predictions. However, this doesn’t consider the business cost of those incorrect predictions. The use of accuracy metrics in such business problems abstracts away the details like TP and FP, and gives an inflated sense of confidence in model predictions that is detrimental to business objectives.
AUC is the go-to metric in such scenarios as it calibrates the trade-off between sensitivity and specificity at the best-chosen threshold.
Further, accuracy measures how well a single model is doing, whereas AUC compares two models as well as evaluates the same model’s performance across different thresholds.
Summary
Choosing the appropriate metric for your model is critical to getting the desired results. Accuracy and AUC are two popular evaluation metrics to objectively measure the model performance. They are both helpful for assessing how well a model is doing and comparing one model to another. The post explained why accuracy is a sufficient metric for balanced data but AUC is well-suited to measure the model’s performance on an imbalanced set.
Vidhi Chugh is an award-winning AI/ML innovation leader and an AI Ethicist. She works at the intersection of data science, product, and research to deliver business value and insights. She is an advocate for data-centric science and a leading expert in data governance with a vision to build trustworthy AI solutions.