Comparing Linear and Logistic Regression
Discussion on an entry-level data science interview question.
Data Science interviews vary in their depth. Some interviews go really deep and test the candidates on their knowledge of advanced models or tricky fine-tuning. But many interviews are conducted at an entry level, trying to test the basic knowledge of the candidate. In this article we will see a question that can be discussed in such an interview. Even though the question is very simple, the discussion brings up many interesting aspects of the fundamentals of machine learning.
Question: What is the difference between Linear Regression and Logistic Regression?
There are actually many similarities between the two, starting with the fact that their names are very similar sounding. They both use lines as the model functions. Their graphs look very similar too.
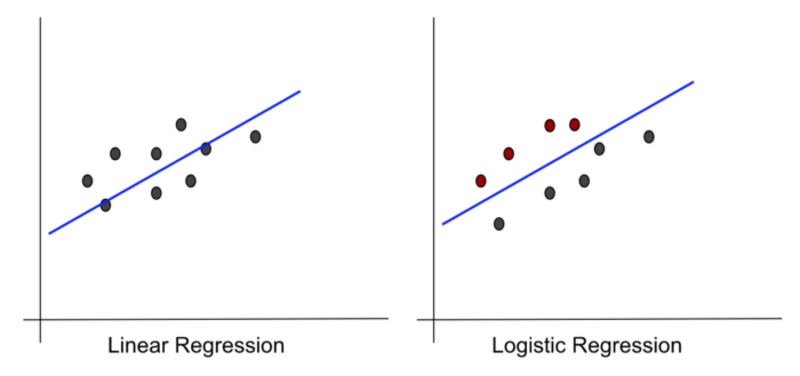
Image by Author
But despite these similarities, they are very different in method as well as application. We will highlight these differences now. For comparison, we will use the following points that are generally considered while discussing any machine learning model:
- Hypothesis or model family
- Input and output
- Loss function
- Optimization technique
- Application
We will now compare Linear Regression (LinReg) and Logistic Regression (LogReg) on each of these points. Let’s start with the application, to put the discussion on the right track.
Application

Image by Rajashree Rajadhyax
Linear Regression is used for estimating a quantity based on other quantities. As an example, imagine that as a student, you run a lemonade stand during the summer vacation. You want to figure out how many glasses of lemonade will be sold tomorrow, so that you can buy enough lemons and sugar. From your long experience in selling lemonade, you have figured out that the sale has a strong relationship with the maximum temperature in the day. So you want to use the predicted max temperature to predict the lemonade sale. This is a classic LinReg application, generally called prediction in ML literature.
LinReg is also used to find out how a particular input affects the output. In the lemonade stall example, suppose you have two inputs- the maximum temperature and whether the day is a holiday. You want to find out which affects the sale more — max temperature or holiday. LinReg will be useful in identifying this.
LogReg is mainly used for classification. Classification is the act of categorizing the input into one of the many possible baskets. Classification is so central to human intelligence that it would not be wrong to say ‘most of the intelligence is classification’. A good example of classification is clinical diagnosis. Consider the elderly, reliable family doctor. A lady walks in and complains of incessant coughing. The doctor conducts various examinations to decide between many possible conditions. Some possible conditions are relatively harmless, like a bout of throat infection. But some are serious, such as tuberculosis or even lung cancer. Based on various factors, the doctor decides what she is suffering from and starts appropriate treatment. This is classification at work.
We must keep in mind that both estimation and classification are guessing tasks rather than computations. There is no exact or correct answer in such types of tasks. The guessing tasks are what machine learning systems are good at.
Model Family
ML systems solve guessing problems by detecting patterns. They detect a pattern from the given data and then use it for performing the task such as estimation or classification. An important pattern that is found in natural phenomena is the relation pattern. In this pattern, one quantity is related to the other quantity. This relation can be approximated by a mathematical function in most of the cases.
Identifying a mathematical function from the given data is called ‘learning’ or ‘training’. There are two steps of learning:
- The ‘type’ of function (for example linear, exponential, polynomial) is chosen by a human
- The learning algorithm learns the parameters (like the slope and intercept of a line) from the given data.
So when we say that ML systems learn from data, it is only partially true. The first step of selecting the type of function is manual and is a part of the model design. The type of function is also called ‘hypothesis’ or ‘model family’.
In both LinReg and LogReg, the model family is the linear function. As you know, a line has two parameters — slope and intercept. But this is true only if the function takes just one input. For most real world problems, there are more than one inputs. The model function for these cases is called a linear function, not a line. A linear function has more parameters to learn. If there are n inputs to the model, the linear function has n+1 parameters. As mentioned, these parameters are learned from the given data. For the purpose of this article, we will continue to assume that the function is the simple line with two parameters. The model function for LogReg is a little more complex. The line is there, but it is combined with another function. We will see this in a moment.
Inputs and Outputs
As we said above, both LinReg and LogReg learn the parameters of the linear function from the given data, called the training data. What does the training data contain?
Training data is prepared by recording some real world phenomena (RWP). For example, the relation between the maximum day temperature and the sale of lemonade is a RWP. We have no visibility of the underlying relation. All we can see are the values of the temperature and the sale everyday. While recording the observations, we designate some quantities as inputs of the RWP and others as output. In the lemonade example, we call the max temperature as input and the sale of lemonade as output.

Image by Author
Our training data contains pairs of inputs and outputs. In this example, the data will have rows of everyday maximum temperature and glasses of lemonade sold. Such will be the input and output to LinReg.
The task that LogReg performs is classification, so its output should be a class. Let’s imagine that there are two classes called 0 and 1. The output of the model should then also be either 0 or 1.
However, this method of specifying output is not very apt. See the following diagram:
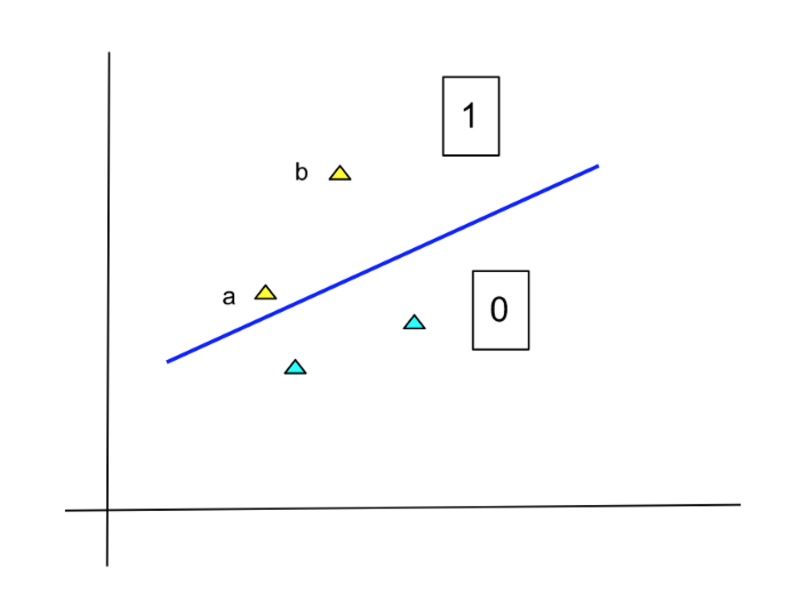
Image by Author
The points in yellow belong to class 1 and the light blue ones belong to 0. The line is our model function that separates the two classes. According to this separator, both the yellow points (a and b) belong to Class 1 . However, the membership of point b is much more certain than that of point a. If the model simply outputs 0 and 1, then this fact is lost.
To correct this situation, the LogReg model produces the probability of each point belonging to a certain class. In the above example, the probability of point ‘a’ belonging to Class 1 is low, whereas that of point ‘b’ is high. Since probability is a number between 0 and 1, so is the output of LogReg.
Now see the following diagram:

Image by Author
This diagram is the same as the earlier, with point c added. This point also belongs to Class 1 and in fact is more certain than point b. However, it would be wrong to increase the probability of a point in proportion to its distance from the line. Intuitively, once you go a certain distance away from the line, we are more or less certain about the membership of those points. We need not increase the probability further. This is in line with the nature of probabilities, whose maximum value can be 1.
In order that the LogReg model is able to produce such output, the line function has to be connected to another function. This second function is called the sigmoid and it has the equation:
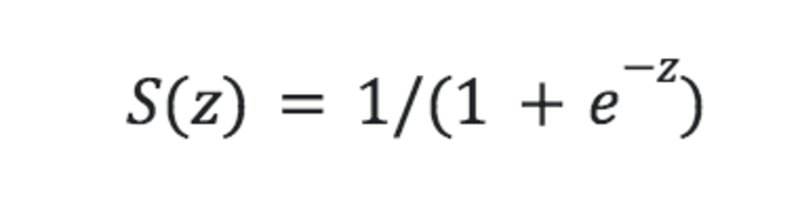
Image by Author
Thus the LogReg model looks like:
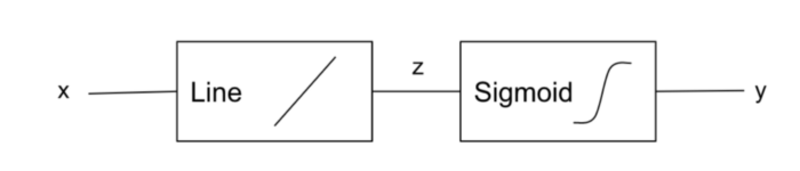
Image by Author
The sigmoid function is also called the ‘logistic’ and is the reason for the name ‘Logistic Regression’.
If there are more than two classes, the output of LogReg is a vector. The elements of the output vector are probabilities of the input being of that particular class. For example, if the first element of the clinical diagnosis model has the value 0.8, it means that the model thinks there is a 80% probability of the patient suffering from cold.
Loss Function
We saw that both LinReg and LogReg learn the parameters of the linear function from the training data. How do they learn these parameters?
They use a method called ‘optimization’. Optimization works by generating many possible solutions for the given problem. In our case, the possible solutions are the sets of (slope, intercept) values. We evaluate each of these solutions using a performance measure. The solution that proves to be best on this measure is finally selected.
In the learning of ML models, the performance measure is sometimes called ‘loss’ and the function which helps us to calculate it is called ‘loss function’. We can represent this as:
Loss = Loss_Function (Parameters_being_evaluated)
The terms ‘loss’ and ‘loss function’ have a negative connotation, which means that a lower value of loss indicates a better solution. In other words, learning is an optimization that aims to find parameters that produce minimum loss.
We will now see the common loss functions used to optimize LinReg and LogReg. Note that many different loss functions are used in actual practice, so we can discuss those which are most common.
For optimization of LinReg parameters, the most common loss function is called Sum of Squares Error (SSE). This function takes the following inputs:
1) All the training data points. For each point, we specify :
a) the inputs, such as the maximum data temperature,
b) the outputs, like the number of lemonade glasses sold
2) The linear equation with parameters
The function then calculates loss using the following formula:
SSE Loss = Sum_for_all_points(
Square_of(
output_of_linear_equation_for_the_inputs — actual_output_from_the_data point
))
The optimization measure for LogReg is defined in a very different way. In the SSE function, we ask the following question:
If we use this line for fitting the training data, how much error will it make?
In designing the measure for LogReg optimization, we ask:
If this line is the separator, how likely is it that we will get the distribution of classes that is seen in the training data?
The output of this measure is thus a likelihood. The mathematical form of the measure function uses logarithms, thus giving it the name Log Likelihood (LL). While discussing the outputs, we saw that the LogReg function involves exponential terms (the terms with e ‘raised to’ z) The logarithms help to deal with these exponentials effectively.
It should be intuitively clear to you that optimization should maximize LL. Think like this: we want to find the line that makes the training data most likely. In practice however, we prefer a measure that can be minimized, so we just take the negative of the LL. We thus get the Negative Log Likelihood (NLL) loss function, though according to me calling it a loss function is not very correct.
So we have the two loss functions: SSE for LinReg and NLL for LogReg. Note that these loss functions have many names, and you should familiarize yourself with the terms.
Summary
Even though Linear Regression and Logistic Regression look and sound very similar, in reality they are quite different. LinReg is used for estimation/prediction and LogReg is for classification. It is true that they both use the linear function as their basis, but LogReg further adds the logistic function. They differ in the way they consume their training data and produce their model outputs. The two also use a very different loss function.
Further details can be probed. Why SSE? How is the likelihood calculated? We did not go into the optimization method here to avoid more mathematics. However, you must keep in mind that optimization of LogReg usually requires the iterative gradient descent method while LinReg can usually do with a quick closed form solution. We can discuss these and more points in another article.
Devesh Rajadhyax have been working in the field of Artificial Intelligence since last eight years. Cere Labs is the company he founded to work on various aspects of AI. Cere Labs has created an AI platform called Cerescope based on Deep Learning, Machine Learning and Cognitive Computing. The platform has been used to build solutions for financial services, healthcare, retail, manufacturing and so on.
Original. Reposted with permission.