
Linear vs Logistic Regression: A Succinct Explanation
Linear Regression and Logistic Regression are two well-used Machine Learning Algorithms that both branch off from Supervised Learning. Linear Regression is used to solve Regression problems whereas Logistic Regression is used to solve Classification problems. Read more here.
They both start with the letter ‘L’ and end with Regression, so it’s quite understandable how people may confuse them. Linear Regression and Logistic Regression are two well-used Machine Learning Algorithms that both branch off from Supervised Learning.
To recap:
Supervised Learning is when the algorithm learns on a labeled dataset and analyses the training data. These labeled data sets have inputs and expected outputs.
Unsupervised Learning learns on unlabeled data, inferring more about hidden structures to produce accurate and reliable outputs.
The relation between Linear and Logistic Regression is the fact that they use labeled datasets to make predictions. However, the main difference between them is how they are being used. Linear Regression is used to solve Regression problems whereas Logistic Regression is used to solve Classification problems.
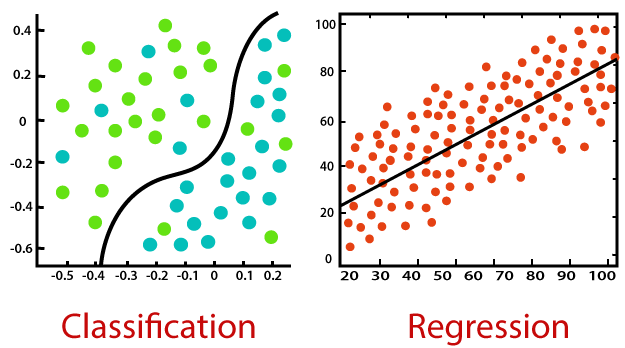
Classification is about predicting a label, by identifying which category an object belongs to based on different parameters.
Regression is about predicting a continuous output, by finding the correlations between dependent and independent variables.
Source: Javatpoint
Linear Regression
Linear Regression is known as one of the simplest Machine learning algorithms that branch from Supervised Learning and is primarily used to solve regression problems.
The use of Linear Regression is to make predictions on continuous dependent variables with the assistance and knowledge from independent variables. The overall goal of Linear Regression is to find the line of best fit, which can accurately predict the output for continuous dependent variables. Examples of continuous values are house prices, age, and salary.
Simple Linear Regression is a regression model that estimates the relationship between one single independent variable and one dependent variable using a straight line. If there are more than two independent variables, we then call this Multiple Linear Regression.
Using the strategy of the line of best fits helps us to understand the relationship between the dependent and independent variable; which should be of linear nature.
The Formula for Linear Regression
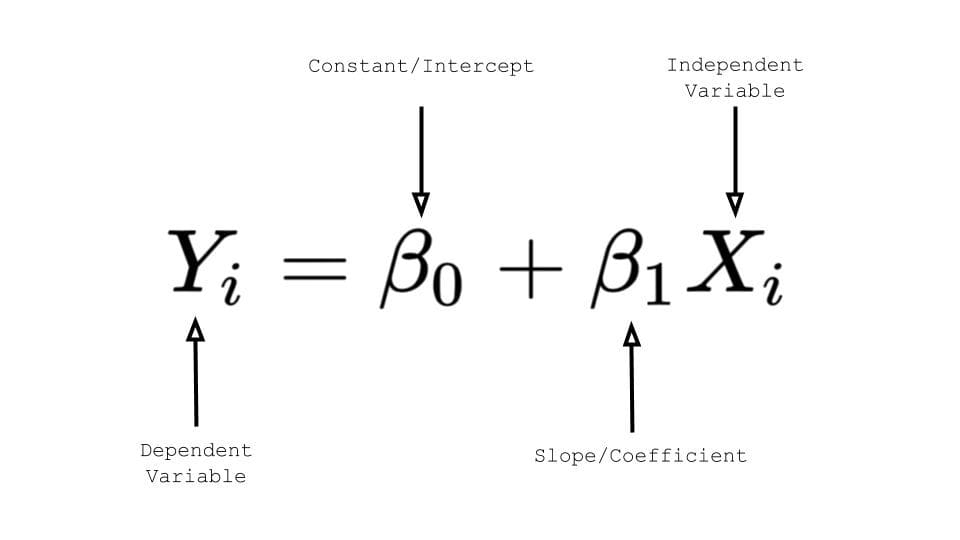
If you remember high school Mathematics, you will remember the formula: y = mx + b and represents the slope-intercept of a straight line. ‘y’ and ‘x’ represent variables, ‘m’ describes the slope of the line and ‘b’ describe the y-intercept, where the line crosses the y-axis.
For Linear Regression, ‘y’ represents the dependent variable, ‘x’ represents the independent variable, ????0 represents the y-intercept and ????1 represents the slope, which describes the relationship between the independent variable and the dependent variable
Source: TowardsDataScience
Logistic Regression
Logistic Regression is also a very popular Machine Learning algorithm that branches off Supervised Learning. Logistic Regression can be used for both Regression and Classification tasks, however, it is mainly used for Classification. If you would like to know more about Logistic Regression used for Classification tasks, click on this link.
An example of Logistic Regression predicting whether it will rain today or not, by using 0 or 1, yes or no, or true and false.
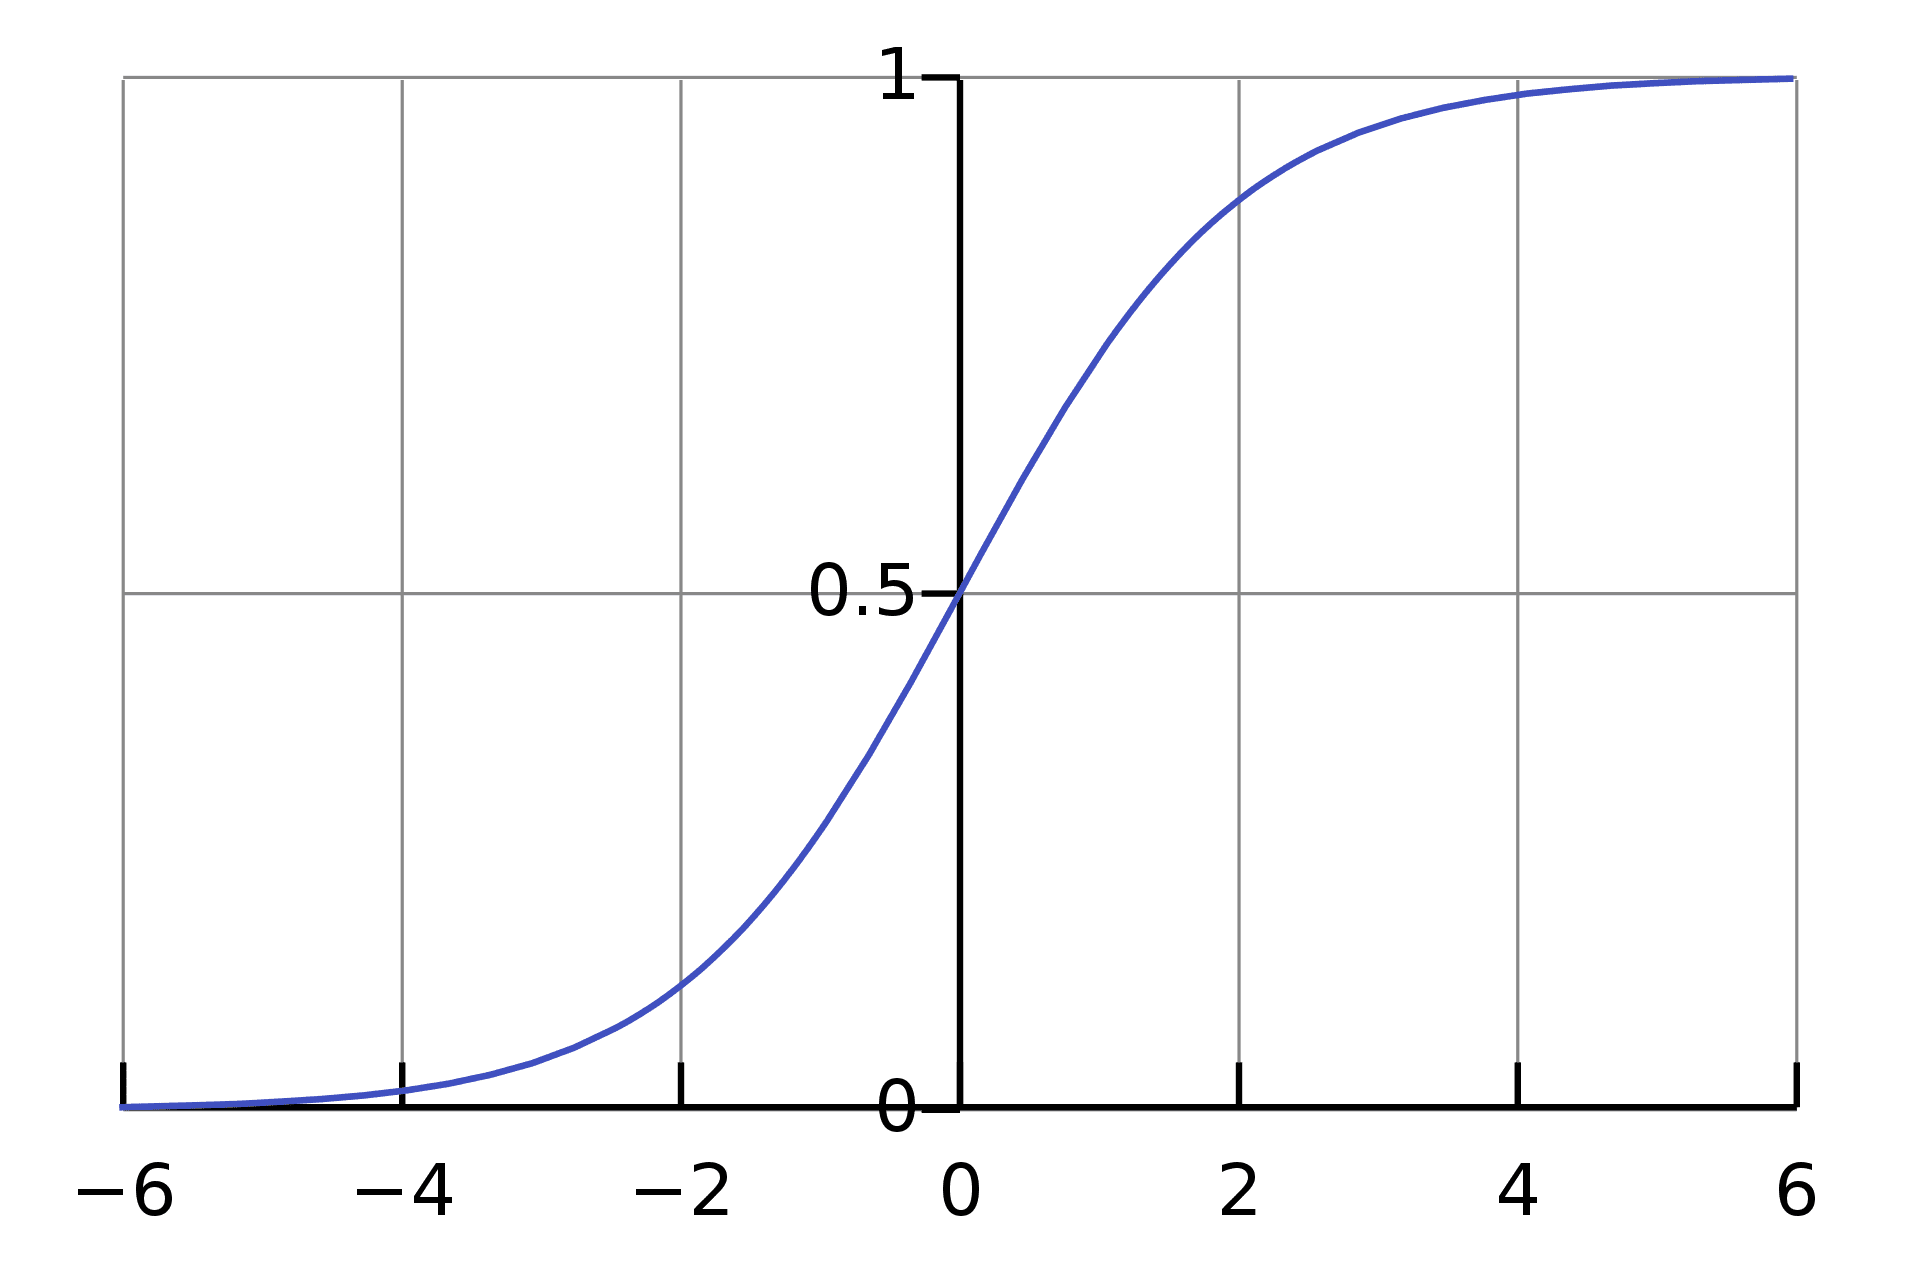
The use of Logistic Regression is to predict the categorical dependent variable with the assistance and knowledge of independent variables. The overall aim of Logistic Regression is to classify outputs, which can only be between 0 and 1.
In Logistic Regression the weighted sum of inputs is passed through an activation function called Sigmoid Function which maps values between 0 and 1.
Source: Wikipedia
The Formula for Sigmoid Function
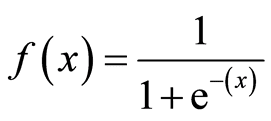
Logistic Regression is based on Maximum Likelihood Estimation, which is a method of estimating the parameters of an assumed probability distribution, given some observed data.
Cost Function
A Cost Function is a mathematical formula used to calculate the error, it is a difference between our predicted value and the actual value. It simply measures how wrong the model is in terms of its ability to estimate the relationship between x and y.
To find out more about Cost Functions, click on this link.
Linear Regression
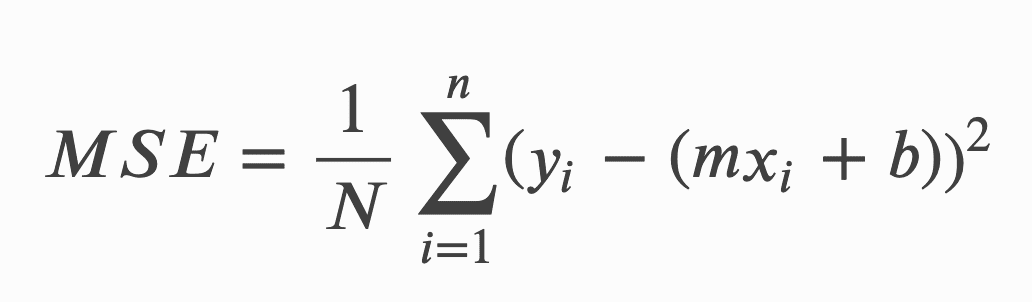
The Cost Function of a Linear Regression is root mean squared error or also known as mean squared error (MSE).
MSE measures the average squared difference between an observation’s actual and predicted values. The cost will be outputted as a single number which is associated with our current set of weights. The reason we use Cost Function is to improve the accuracy of the model; minimising MSE does this.
The formula for MSE:
Logistic Regression
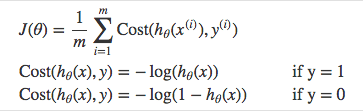
The Cost Function of a Logistic Regression cannot use MSE because our prediction function is non-linear (due to sigmoid transform). Therefore we use a cost function called Cross-Entropy, also known as Log Loss.
Cross-entropy measures the difference between two probability distributions for a given random variable or set of events.
The formula for Cross Entropy:
Linear vs Logistic Comparison
| Linear Regression | Logistic Regression |
| Used to predict the continuous dependent variable using a given set of independent variables. | Used to predict the categorical dependent variable using a given set of independent variables. |
| The outputs produced must be a continuous value, such as price and age. | The outputs produced must be Categorical values such as 0 or 1, Yes or No. |
| The relationship between the dependent variable and independent variable must be linear. | The relationship DOES NOT need to be linear between the dependent and independent variables. |
| Used for solving Regression problems. | Used for solving Classification problems. |
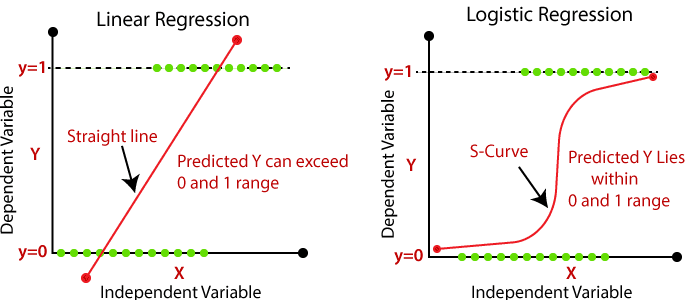
| We are finding and using the line of best fit to help us easily predict outputs. | We are using the S-curve (Sigmoid) to help us classify predicted outputs. |
| Least square estimation method is used for the estimation of accuracy. | Maximum likelihood estimation method is used for the estimation of accuracy. |
| There is a possibility of collinearity between the independent variables. | There should not be any collinearity between the independent variable. |
Source: javatpoint
Nisha Arya is a Data Scientist and Freelance Technical Writer. She is particularly interested in providing Data Science career advice or tutorials and theory based knowledge around Data Science. She also wishes to explore the different ways Artificial Intelligence is/can benefit the longevity of human life. A keen learner, seeking to broaden her tech knowledge and writing skills, whilst helping guide others.