Data Science ETL Pipelines with DuckDB
In this article, we will learn how to create an ETL pipeline using DuckDB.
Image by Author | Ideogram
ETL — meaning Extract, Transform, Load — is a process that moves and prepares data for subsequent use, such as data analysis or machine learning modelling. ETL is a crucial activity for data scientists, as it enables us to acquire the necessary data for our work.
To assist the ETL process, various tools are available to facilitate our work, and one of them is DuckDB. DuckDB is an open-source OLAP SQL database management system designed to handle data analytics workloads with in-memory processing effectively. It’s an excellent tool for data scientists, regardless of the size of the data being worked with.
Creating a data science ETL pipeline is crucial for data scientists; it’s essential to understand the process thoroughly. In this article, we will learn how to create an ETL pipeline using DuckDB.
Preparation
First, we will set up all the necessary components to simulate the ETL pipeline in a real-world data science project. All the code demonstrated in this article is also available in the GitHub repository.
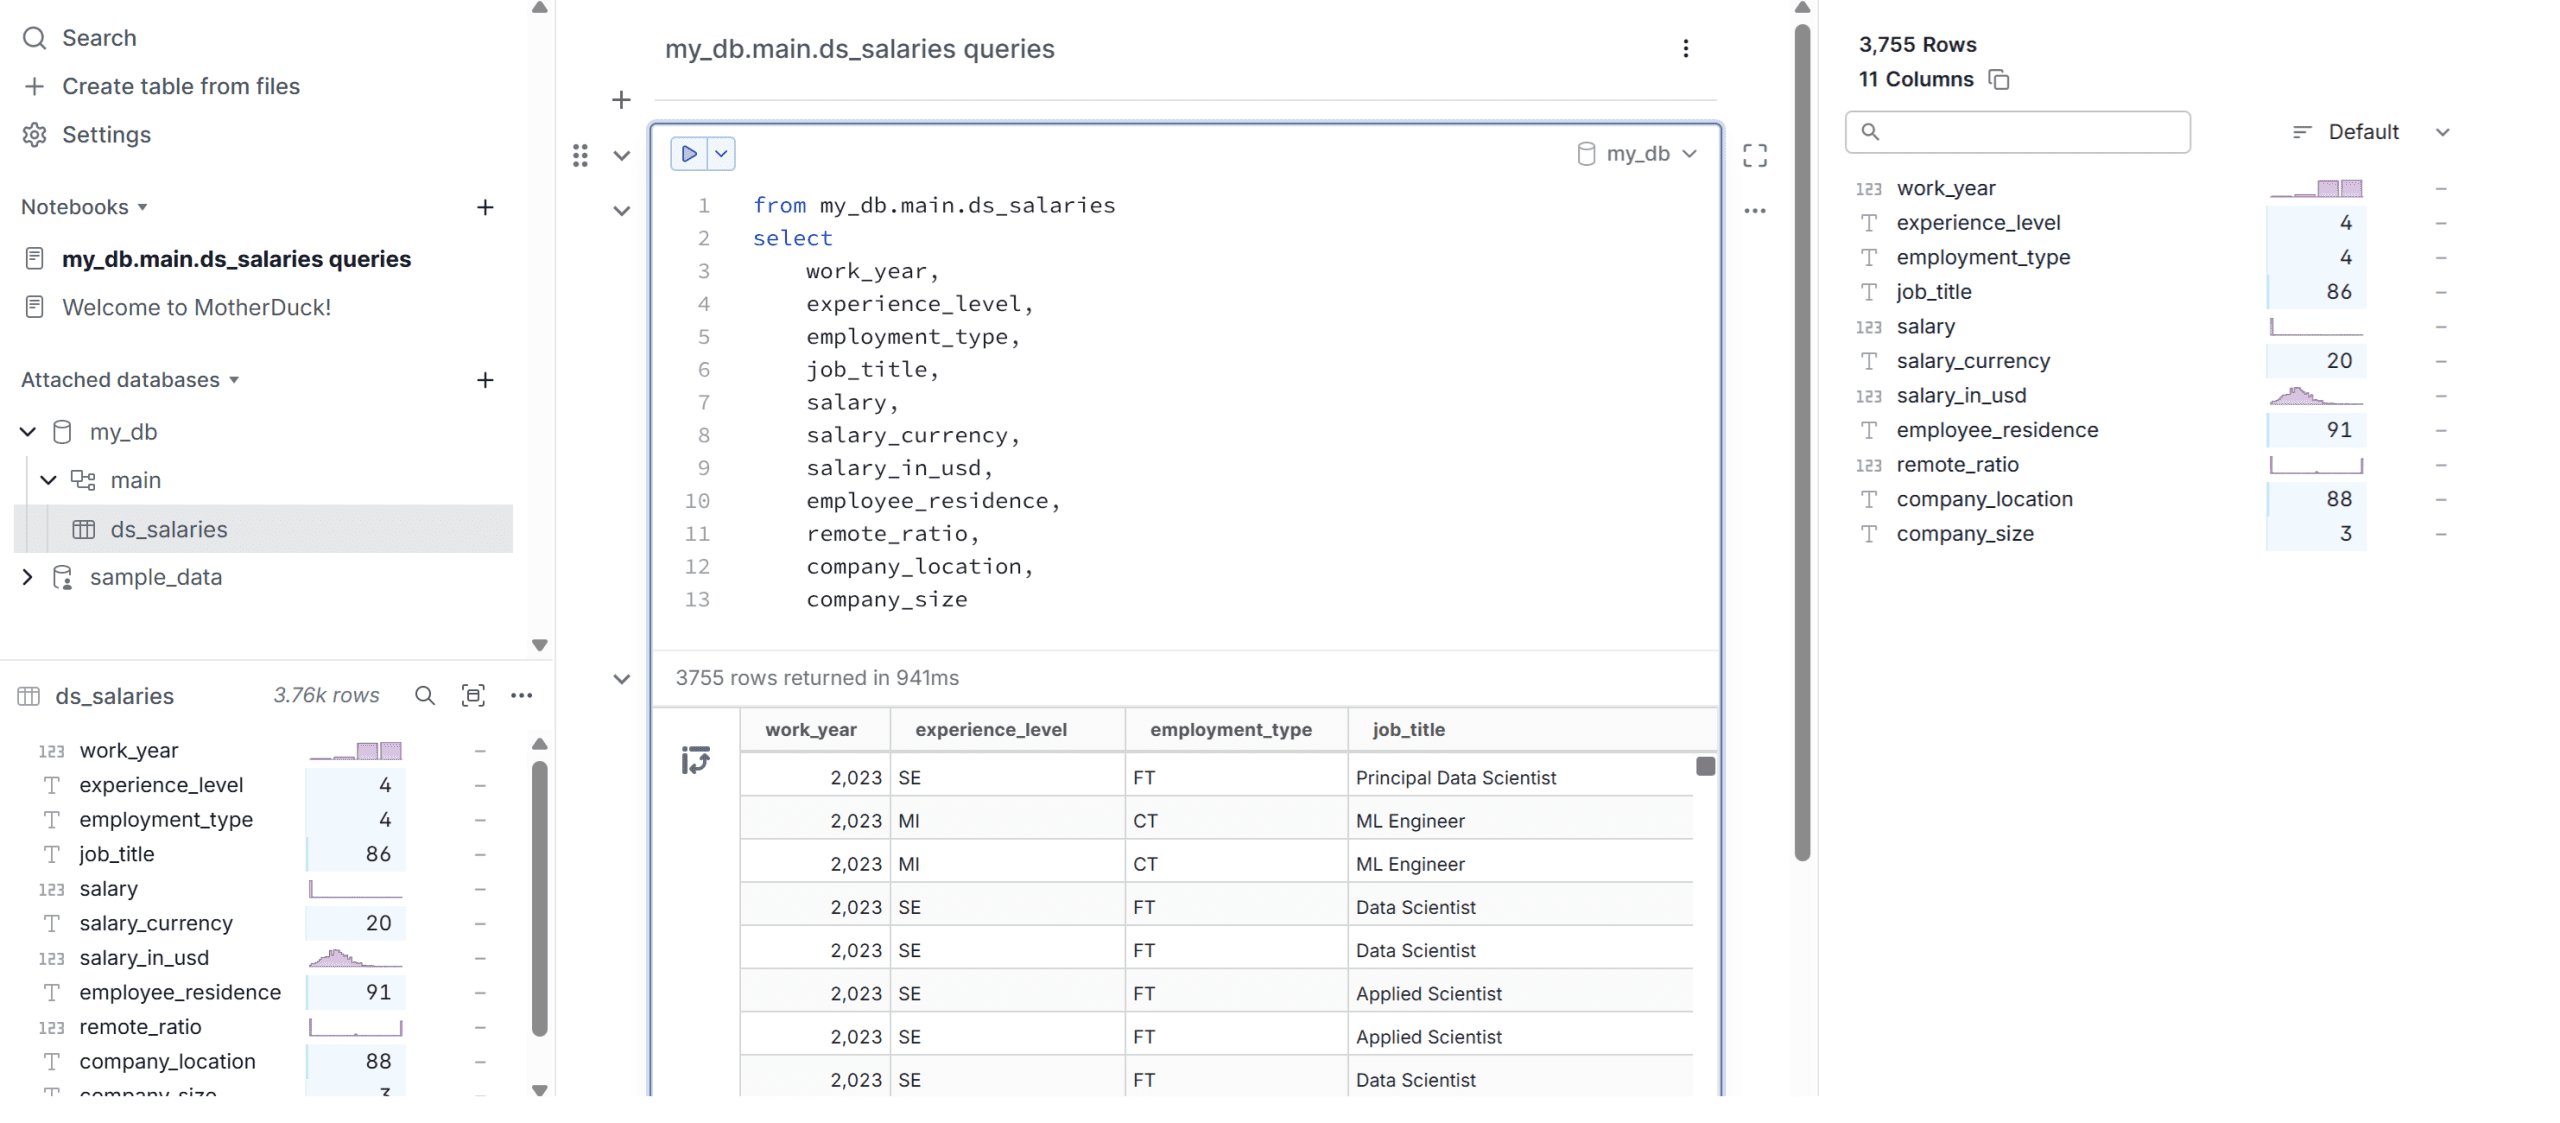
The first thing we need will be the dataset for our article. In this example, we will use the data scientist salary data from Kaggle. For the data warehouse, we will utilize the DuckDB-powered cloud data warehouse, known as Motherduck. Register for a free account, then select to create a table from the files using the data science salary data, and place them in the my_db database.
If you complete this step, you can then query the dataset, and it will be displayed as shown in the image below.
Once the database is ready, acquire the access tokens, which we will use to access the cloud database.
Next, open your IDE, such as Visual Studio Code, to set up the pipeline environment. The first step is to create the virtual environment, which can be done using the following code.
python -m venv duckdb_venv
You can change the virtual environment name to any name you like. Activate the virtual environment, and we will install all the required libraries. Create a text file called requirements.txt and fill it with the following library names.
duckdb
pandas
pyarrow
python-dotenv
With the file ready, we will install the library required for the project using the code below.
pip install -r requirements.txt
If every library is successfully installed, we will set up the environment variable using the .env file. Create the file and insert the MOTHERDUCK_TOKEN inside, using the token you just acquired from Motherduck.
Now that the preparation is complete, let’s proceed with setting up the ETL pipeline using DuckDB.
ETL pipelines with DuckDB
Working with DuckDB is similar to working with SQL operations, but with much simpler connectivity. We will utilize the DuckDB in-memory feature to process our data by running queries in the Python environment but we will load the data back into the Motherduck cloud database.
First, create a Python file that will contain the ETL pipeline. I made a file called etl_duckdb.py, but you can use different names if you prefer.
Inside the file, we will explore how to set up the data science ETL pipeline with DuckDB. Initially, we will need to connect DuckDB to the cloud database to retrieve the necessary data.
import os
import duckdb
from dotenv import load_dotenv

load_dotenv()
MD_TOKEN = os.getenv("MOTHERDUCK_TOKEN")
con = duckdb.connect(f'md:?motherduck_token={MD_TOKEN}')
After that, we will create a schema named analytics to store the data we extract.
con.sql("CREATE SCHEMA IF NOT EXISTS analytics;")
You can see that the operations in DuckDB are exactly how you will use the SQL queries. If you are already familiar with SQL operations, then creating the pipeline will become much easier.
Next, we will extract the raw data into another table just to show you that it’s possible to use DuckDB for extracting and loading the same data into another table.
con.sql("""
CREATE OR REPLACE TABLE raw_salaries AS
SELECT
    work_year,
    experience_level,
    employment_type,
    job_title,
    salary,
    salary_currency,
    salary_in_usd,
    employee_residence,
    remote_ratio,
    company_location,
    company_size
FROM my_db.ds_salaries;
""")
With the data prepared, we can perform any transformations and load the modified data for subsequent analysis.
For example, let’s transform the data into average salary data based on work year and experience level, which we will load into the table avg_salary_year_exp.
con.sql("""
CREATE OR REPLACE TABLE analytics.avg_salary_year_exp AS
SELECT
    work_year,
    experience_level,
    ROUND(AVG(salary_in_usd), 2) AS avg_usd_salary
FROM raw_salaries
GROUP BY work_year, experience_level
ORDER BY work_year, experience_level;
""")
Let’s check the transformed data that we have loaded into the table using the following code.
con.sql("SELECT * FROM analytics.avg_salary_year_exp LIMIT 5").show()
The result is a table shown in the output below.
┌───────────┬──────────────────┬────────────────┐
│ work_year │ experience_level │ avg_usd_salary │
│   int64   │     varchar      │     double     │
├───────────┼──────────────────┼────────────────┤
│      2020 │ EN               │       57511.61 │
│      2020 │ EX               │      139944.33 │
│      2020 │ MI               │       87564.72 │
│      2020 │ SE               │       137240.5 │
│      2021 │ EN               │       54905.25 │
└───────────┴──────────────────┴────────────────┘
Using DuckDB, we can efficiently perform ETL without any hassle.
As DuckDB is quite flexible in helping our operations, we can also utilize Pandas to perform ETL operations.
For example, we can take the previous average salary data and transform it into a DataFrame object, where we can transform it even further.
df_avg = con.sql("SELECT * FROM analytics.avg_salary_year_exp").df()
df_avg["avg_salary_k"] = df_avg["avg_usd_salary"] / 1_000
We can see the result of the DataFrame we have transformed using the code below.
print(df_avg.head())
Where the output is similar to the one below.
  work_year experience_level  avg_usd_salary  avg_salary_k
0       2020               EN        57511.61      57.51161
1       2020               EX       139944.33     139.94433
2       2020               MI        87564.72      87.56472
3       2020               SE       137240.50     137.24050
4       2021               EN        54905.25      54.90525
Using the DataFrame above, we can register it in DuckDB, which will treat the DataFrame as a table using the code below.
con.register("pandas_avg_salary", df_avg)
The Pandas DataFrame is now ready for further processing; for example, we can transform the data and reload it into the cloud database.
con.sql("""
CREATE OR REPLACE TABLE analytics.avg_salary_year_exp_pandas AS
SELECT
  work_year,
  experience_level,
  avg_salary_k
FROM pandas_avg_salary
WHERE avg_salary_k > 100
ORDER BY avg_salary_k DESC
""")
You can see the result using the code below.
con.sql("SELECT * FROM analytics.avg_salary_year_exp_pandas LIMIT 5").show()
The output is shown below.
┌───────────┬──────────────────┬──────────────┐
│ work_year │ experience_level │ avg_salary_k │
│   int64   │     varchar      │    double    │
├───────────┼──────────────────┼──────────────┤
│      2023 │ EX               │    203.70568 │
│      2022 │ EX               │    188.26029 │
│      2021 │ EX               │      186.128 │
│      2023 │ SE               │    159.56893 │
│      2022 │ SE               │    147.65969 │
└───────────┴──────────────────┴──────────────┘
That’s all you need to develop a simple ETL pipeline for a data science project. You can extend the pipeline with automation and a scheduler using a CRON job, depending on the project requirements.
Conclusion
ETL, or Extract, Transform, Load, is a process that moves and prepares data for further usage. For a data scientist, ETL is useful for any work that requires data, such as data analysis or machine learning modelling.
In this article, we have learned how to create an ETL pipeline for data science work using DuckDB. We demonstrated how to extract data from a cloud database, transformed it using SQL queries and Pandas DataFrames, and loaded it back into the cloud database.
I hope this has helped!
Cornellius Yudha Wijaya is a data science assistant manager and data writer. While working full-time at Allianz Indonesia, he loves to share Python and data tips via social media and writing media. Cornellius writes on a variety of AI and machine learning topics.