How to Use R for Data Transformation with dplyr
dplyr in R simplifies data transformation. This article will walk you through the essential functions of dplyr to help you manage and analyze your data efficiently.

Image by Editor | Midjourney
It's important to transform data for effective data analysis. R's 'dplyr' package makes data transformation simple and efficient. This article will teach you how to use the dplyr package for data transformation in R.
Install dplyr
Before using dplyr, you must install and load it into your R session. Now you’re ready to start using dplyr functions.
install.packages("dplyr")
library(dplyr)
Select Columns
The 'select()' function lets you pick columns from a data frame. This helps you focus on just the variables you need in your dataset.
selected_data <- mtcars %>%
  select(mpg, cyl, hp)

head(selected_data)

In this example, selected_data will include just the mpg, cyl, and hp columns from the mtcars dataset.
Rename Columns
The 'rename()' function allows you to change the names of columns in a data frame. This helps give columns clearer names.
renamed_data <- mtcars %>%
  rename(
    Miles_Per_Gallon = mpg,
    Cylinders = cyl,
    Horsepower = hp
  )

head(renamed_data)

In this example, the mpg column in the mtcars dataset is renamed to Miles_Per_Gallon, cyl to Cylinders, and hp to Horsepower.
Filter Rows
The 'filter()' function subsets your data based on conditions. It helps pick out rows that match specific conditions.
filtered_data <- mtcars %>%
  filter(cyl == 6)

filtered_data

This command filters the rows to include only those where the number of cylinders (cyl) is 6.
Arrange Rows
The 'arrange()' function sorts your data frame based on one or more columns. You can define the order for each column.
arranged_data <- mtcars %>%
  arrange(desc(mpg))

head(arranged_data)

Here, arranged_data will have rows ordered from highest to lowest by miles per gallon (mpg).
Modify Columns
Use the 'mutate()' function to add new columns or change existing ones. This helps create new variables or change your data.
mutated_data <- mtcars %>%
  mutate(mpg_per_cyl = mpg / cyl)

head(mutated_data)

This adds a new column mpg_per_cyl that represents miles per gallon per cylinder.
Summarize Data
The 'summarize()' function helps to generate summary statistics for your data. You can calculate measures like mean and standard deviation.
summary_data <- mtcars %>%
  group_by(cyl) %>%
  summarize(mean_mpg = mean(mpg), sd_mpg = sd(mpg))

summary_data

In this example, summary_data contains the mean and standard deviation of mpg for each group of cyl.
Group Data
The 'group_by()' function organizes your data into groups based on one or more variables. This lets you calculate statistics for each group separately.
grouped_data <- mtcars %>%
  group_by(cyl)

head(grouped_data)

This command groups the data by the number of cylinders (cyl). You can then apply other functions like summarize() to these groups.
Apply Functions Across Columns
The 'across()' function lets you apply a function to several columns. This helps you make changes or calculations across multiple columns easily.
scaled_data <- mtcars %>%
  mutate(across(where(is.numeric), scale))

head(scaled_data)
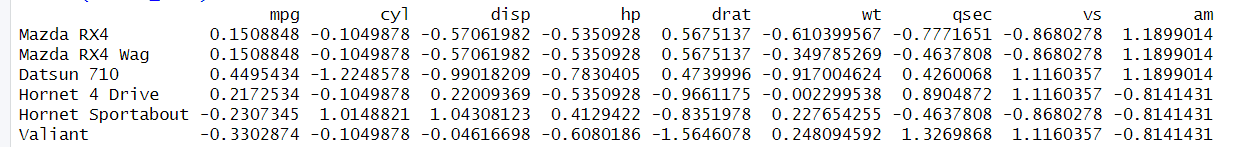
This example scales all numeric columns in the mtcars dataset. It changes the values in each column. Each column will have a mean of 0. Each column will have a standard deviation of 1.
Use Pipes (%>%)
The pipe operator '%>%' is an important part of dplyr. It lets you connect several steps in your code. It passes the result from one step to the next. This makes your code easier to read.
result <- mtcars %>%
  filter(cyl == 6) %>%
  arrange(desc(mpg)) %>%
  mutate(mpg_per_cyl = mpg / cyl)

result

This code processes the mtcars dataset by filtering out cars with only 6 cylinders. It then sorts these cars based on miles per gallon (mpg) in descending order. Lastly, it adds a new column that shows the mpg divided by the number of cylinders.
Conclusion
dplyr makes data transformation in R easy and fast. Using dplyr helps you clean and prepare your data for analysis quickly. You can learn more about dplyr at this website.
Jayita Gulati is a machine learning enthusiast and technical writer driven by her passion for building machine learning models. She holds a Master's degree in Computer Science from the University of Liverpool.