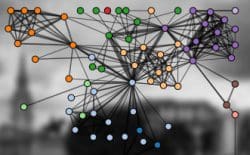
Interactive Network and Graph Data Repository
The network repository currently hosts over 500+ graphs/networks that span 19 collections of graphs from social science, machine learning, scientific computing, and many others.
By Ryan A. Rossi, Oct 2014.
 Network Data Repository Exploratory Analysis & Visualization
Unlike other data repositories (e.g., UCI ML Data Repository, and SNAP), the network data repository (networkrepository.com) allows users to interactively analyze and visualize such data using our web-based interactive graph analytics platform.
Users can in real-time analyze, visualize, compare, and explore data along many different dimensions. Our goal is to make it easy for people to discover key insights into the data extremely fast with little effort while also providing a medium for people to share data, visualizations, and insights. Other key factors that differentiate us from the state-of-the-art repositories is the number of graph datasets, their size, and variety. While other data repositories are static, they also do not allow user discussion, feedback, comments, etc.
We are striving to incorporate these social and collaborative aspects tightly into our platform. For instance, users can create a profile to share and/or view their recent visualizations, uploaded/constructed graphs, previous graph queries, etc.
Ryan A. Rossi is a PhD Fellow (NSF/NDSEG/Andrews) in Computer Science / Machine Learning at Purdue University
http://www.ryanrossi.com
Related:
