Supermarket customers segmentation using Self-Organizing Mapping
See how a leading European supermarket chain improved customer value and profitability and identified key customer groups by applying business intelligence and analytics techniques like self-organizing maps.
By Gregory Philippatos (www.directing.gr), Oct 2014
The Challenge
A European Leader Supermarket chain decided to design and implement a Business Intelligence Strategy and applications in order to increase competitiveness and profitability.
The Solution
Customer Centric Positioning
Consumers are the ultimate arbiters of enterprise ability to identify and predict market trends and to procure and distribute products and services that represent desired customer value, at the right price and through the right channels.
Firms must be aligned to consumers’ continually evolving needs and expectations of value.
As a result, the ability to innovate successfully to create customer-centric differentiation is critical to the overall success of the sector and increasingly decisive in the survival of individual enterprises.
In order to achieve a Customer-Centric framework, we created a Business Intelligence architectural plan that analyzes the interferences (input) of all external factors on customers and the consequences on their final purchase decision (output).
Behavioral Segmentation
In the heart of our Business Intelligence applications platform is Customers Segmentation based on purchase behaviour.
The biggest problem with segmentation is that a supermarket has a huge, continuously changing number of product codes (new products, seasonal products, promotions that makes a product appears with a different code, etc…) that makes any segmentation based on purchase behaviour almost impossible.
In the other hand using only categories of products make decision makers loose information that only products detailed description offers. For example customers who prefers white yogurt 0% are different from the those who prefers a yogurt with fruits 2%. And customers who prefers Danone yogurt differs from those who prefers Nestle yogurt.
Clustering with neural networks
Our objective concerning segmentation was to obtain a scientific state of the art segmentation and in same time useful for business decision making.
In order to solve this problem we opted for a two layers approach, training Self-Organizing Maps first with an intermediary categorization (sub categories of products plus brands) and finally with detailed products.
We used as data customers annual transactions and unsupervised learning and Self Organized Map that allows to find groups of clients (Clusters) that exhibit a certain degree of similarity in respect to a number of features that describe these objects.
We opted for 25 clusters solution (5 X 5) as it is important for a retail company to have the less possible groups of customer in order to design cost effective business and marketing campaigns.

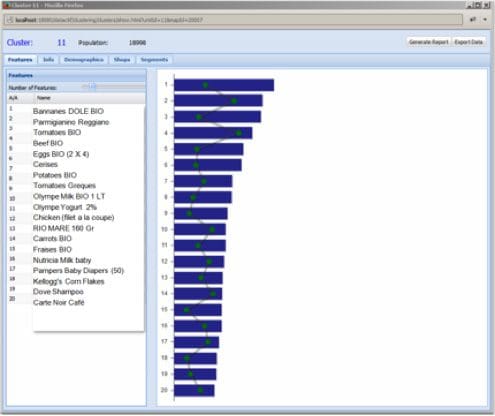
Features extracted values allows us to examine each cluster separately, finding how and why it was formed as in bellow Figure, where we see that Cluster 11 is made of families with young children, that prefer biological products.

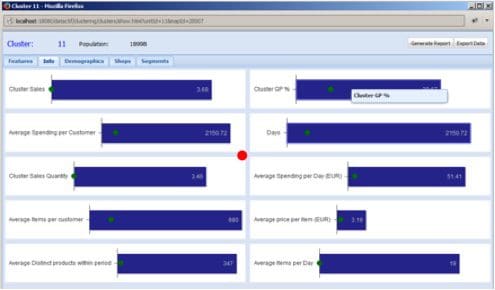
By classifying clusters based on data such as : total sales, net profit, etc... we obtained the economical impact of each cluster on enterprise profitability.

Customers Segmentation History
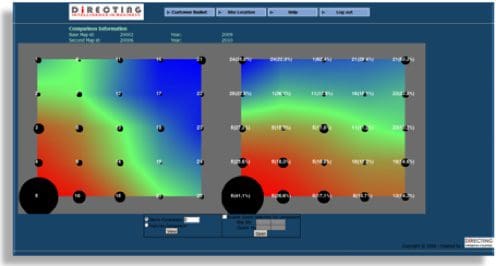
Customers Segmentation observed through time, allows comparison for the same clients between two time periods and offers a macroscopic point of view on customers evolution in a social and economic context, measuring in same time the efficiency of the Enterprise's strategy .
In the following Figure (comparison between 2009 and 2010), we observe that 41,1% of clients from Cluster 5 (new and basic clients) remain in the same cluster and have the same consumption habits between 2009 and 2010.
A significant part of the rest, moves horizontally from cluster 5 to cluster 25 (all products from the same SM, that means they became heavy and loyal clients) and another part moves vertically from cluster 5 to cluster 1 (fruits and vegetables, biological and healthy products in general)

Related:
The Challenge
A European Leader Supermarket chain decided to design and implement a Business Intelligence Strategy and applications in order to increase competitiveness and profitability.
The Solution
Customer Centric Positioning
Consumers are the ultimate arbiters of enterprise ability to identify and predict market trends and to procure and distribute products and services that represent desired customer value, at the right price and through the right channels.
Firms must be aligned to consumers’ continually evolving needs and expectations of value.
As a result, the ability to innovate successfully to create customer-centric differentiation is critical to the overall success of the sector and increasingly decisive in the survival of individual enterprises.
In order to achieve a Customer-Centric framework, we created a Business Intelligence architectural plan that analyzes the interferences (input) of all external factors on customers and the consequences on their final purchase decision (output).
Behavioral Segmentation
In the heart of our Business Intelligence applications platform is Customers Segmentation based on purchase behaviour.
The biggest problem with segmentation is that a supermarket has a huge, continuously changing number of product codes (new products, seasonal products, promotions that makes a product appears with a different code, etc…) that makes any segmentation based on purchase behaviour almost impossible.
In the other hand using only categories of products make decision makers loose information that only products detailed description offers. For example customers who prefers white yogurt 0% are different from the those who prefers a yogurt with fruits 2%. And customers who prefers Danone yogurt differs from those who prefers Nestle yogurt.
Clustering with neural networks
Our objective concerning segmentation was to obtain a scientific state of the art segmentation and in same time useful for business decision making.
In order to solve this problem we opted for a two layers approach, training Self-Organizing Maps first with an intermediary categorization (sub categories of products plus brands) and finally with detailed products.
We used as data customers annual transactions and unsupervised learning and Self Organized Map that allows to find groups of clients (Clusters) that exhibit a certain degree of similarity in respect to a number of features that describe these objects.
We opted for 25 clusters solution (5 X 5) as it is important for a retail company to have the less possible groups of customer in order to design cost effective business and marketing campaigns.
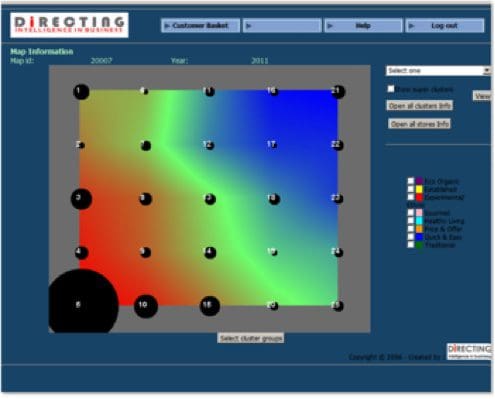
Features extracted values allows us to examine each cluster separately, finding how and why it was formed as in bellow Figure, where we see that Cluster 11 is made of families with young children, that prefer biological products.
By classifying clusters based on data such as : total sales, net profit, etc... we obtained the economical impact of each cluster on enterprise profitability.
Customers Segmentation History
Customers Segmentation observed through time, allows comparison for the same clients between two time periods and offers a macroscopic point of view on customers evolution in a social and economic context, measuring in same time the efficiency of the Enterprise's strategy .
In the following Figure (comparison between 2009 and 2010), we observe that 41,1% of clients from Cluster 5 (new and basic clients) remain in the same cluster and have the same consumption habits between 2009 and 2010.
A significant part of the rest, moves horizontally from cluster 5 to cluster 25 (all products from the same SM, that means they became heavy and loyal clients) and another part moves vertically from cluster 5 to cluster 1 (fruits and vegetables, biological and healthy products in general)
Related: