Data Science Basics: Power Laws and Distributions
Power laws and other relationships between observable phenomena may not seem like they are of any interest to data science, at least not to newcomers to the field, but this post provides an overview and suggests how they may be.
Power laws are a powerful class of tool which can help us better understand the world around us.
Also known as scaling laws, power laws essentially imply that a small number of occurrences of some phenomena are frequent, or very common, while a large number of of occurrences of the same phenomena are infrequent, or very rare; the exact relationship between these relative frequencies differ between power law distributions. Some of the wide array of naturally occurring and man made phenomena which power laws are able to describe include income disparities, word frequencies of a given language, city sizes, website sizes, magnitudes of earthquakes, book sales rankings, and surname popularity.
The all-knowing Wikipedia more formally defines a power law as follows:
[A] power law is a functional relationship between two quantities, where a relative change in one quantity results in a proportional relative change in the other quantity, independent of the initial size of those quantities: one quantity varies as a power of another.
Contrast this concept with bell curves, such as the normal distribution, which is accurate in describing or approximating numerous phenomena as well.
A few very simple examples of power laws include:
- increasing x by 1 and subsequently (and always) increasing y by 3
- the area of a square (length of a side doubles, area increases by a factor of four)
- the frequency of words in the English language (Zipf's Law; see below)
This post will provide an overview of a few of the more popular power laws and give examples of what they describe, hopefully bringing them to the attention of new data science practitioners. Why? Well, the more ways we investigate, scrutinize, approach, and appreciate our data, the better the chances we are able to understand it, share it, and ultimately help others understand it.
Zipf's Law, named after linguist George Kinglsey Zipf, was originally intended to describe the relationship between word frequencies in document collections. Which it does quite remarkably. If a document collection's words are ordered by frequency, and y is used to describe the number of times that the xth word appears, Zipf's observation is concisely captured as y = cx-1/2 (item frequency is inversely proportional to item rank).
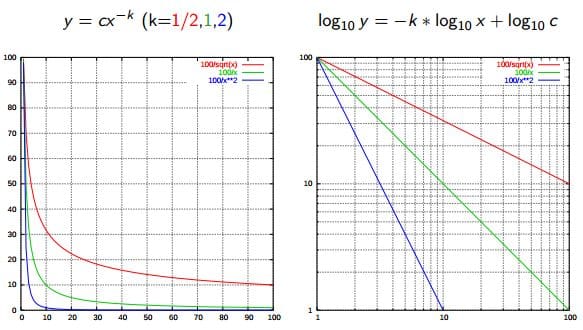
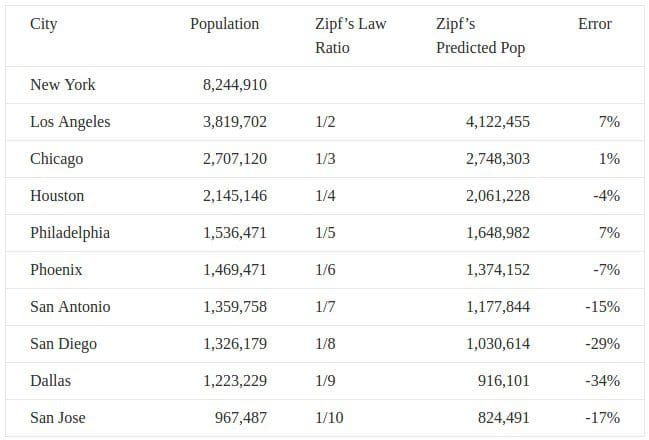
Curiously, Zipf's Law actually describes or approximates a whole host of phenomena beyond word frequencies as well. Famous examples include the population ranks of cities in various countries, and the population ranks of US states.
Source: www.dangreller.com/thats-just-not-normal-power-laws
You can see by the error rate that it is not perfect, but is a reasonable approximation.
Pareto Principle (aka The 80/20 Rule)
The Pareto Principle, named after economist Vilfredo Pareto, states that it can be approximated that 80% of the effects of some particular phenomena are a result of 20% of the phenomena's causes. The actual power law associated with this principle is the Pareto distribution, which describes, among other things, hard disk drive error rates, human settlement sizes, meteorite sizes, and oil reserve discoveries.
Pareto originally used the principle to famously describe the distribution of wealth, intimating that a majority (80%) of societal wealth is controlled by a minority (20%) of its members. The exact numbers may slide, but this principle is still applied and rigorously researched in economics today.
Lotka's Law, named after mathematician Alfred Lotka, describes author publication frequency in a given academic field. The law states that the number of authors making x academic contributions in a particular time period is a fraction of the number of authors making only one contribution; the observation is 1 / xa, where a is very close to 2 (but is academic discipline-specific). As a result, we can approximate that 1/4 the number of authors publish 2 papers as publish a single paper, 1/9 as many publish 3 papers, 1/16 publish 4 papers, and so on.
None of the above well-known laws have touched on the following phenomena, which are also approximately described by power laws and custom exponents of their very own, relationships I encourage you to seek out:
- Product sales
- Web graph node degrees
- Web site sizes

Source: www.technollama.co.uk/whatever-happened-to-the-long-tail
The Long Tail, popularized by Chris Anderson in a 2004 Wired article and followup book of the same name, is a manifestation of particular types of power laws. If you have read this far and still can't figure out how power laws can be of practical use in data science (or even much more broadly), I suggest you investigate this particular concept further, which is not nearly as revolutionary as its "discovery" and popularization suggest, but does help frame and apply the conversation.
Many power laws exist. Furthermore, there are all sorts of other relationships between phenomena in the world. Investigating and understanding as many relationships as possible can be very insightful for data scientists looking to make sense of the data they are studying, and wanting to put it in terms others can understand. Beware the flip side, however; not all relationships can be approximated as such, and trying to force data into an artificial description can be misleading. Power laws (and descriptive relationships, in general) should be treated as another potential tool at your disposal.
Related: