 Pandas Cheat Sheet: Data Science and Data Wrangling in Python
 Pandas Cheat Sheet: Data Science and Data Wrangling in Python
The Pandas library can seem very elaborate and it might be hard to find a single point of entry to the material: with other learning materials focusing on different aspects of this library, you can definitely use a reference sheet to help you get the hang of it.
By Karlijn Willems, Data Science Journalist & DataCamp Contributor.
Data Wrangling With Python
A very important component in the data science workflow is data wrangling. And just like matplotlib is one of the preferred tools for data visualization in data science, the Pandas library is the one to use if you want to do data manipulation and analysis in Python. This library was originally built on NumPy, the fundamental library for scientific computing in Python. The data structures that the Pandas library offers are fast, flexible and expressive and are specifically designed to make real-world data analysis significantly easier.
However, this flexibility might come at a cost for beginners; When you’re first starting out, the Pandas library can seem very elaborate and it might be hard to find a single point of entry to the material: with other learning materials focusing on different aspects of this library, you can definitely use a reference sheet to help you get the hang of it.
That’s where DataCamp’s Pandas tutorial and cheat sheet comes in.
Pandas Cheat Sheet
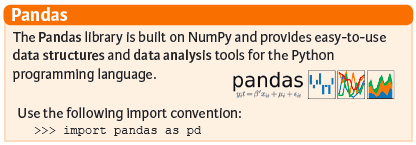
One of the first things that you need to do to make use of this library is importing it. What might come unnaturally to people who are just starting with Python and/or programming is the import convention. However, if you have seen the first cheat sheet, you’ll already have some idea; In this case, the import convention states that you should import pandas as pd. You can then use this abbreviation whenever you use Pandas modules in your code.
That’s very handy!
Pandas Data Structures
You’ll immediately see how this import works when you’re getting started with the Pandas data structures. But what is exactly meant when you talk about “data structures”? The easiest way to think of them as structured containers for your data. Or, if you have already worked with NumPy, these data structures are basically arrays with indices.
Watch this video if you want to know more about how Pandas data structures are connected to NumPy arrays.
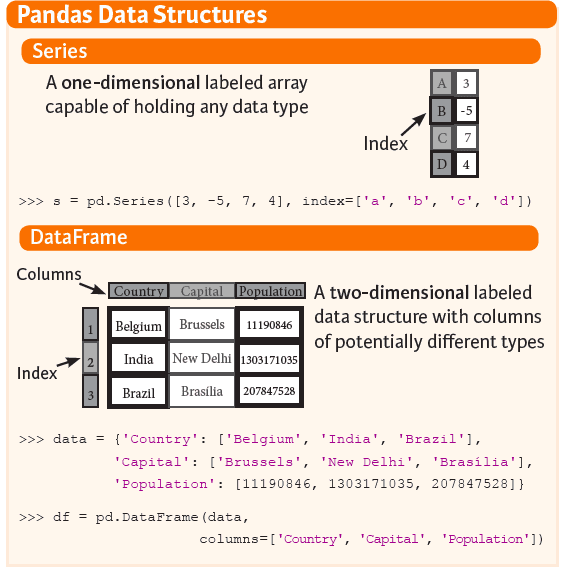
In any case, the basic structures that the Pandas library uses are Series and DataFrames. A Series is basically a 1D array with indices. To make a simple Series, you use pd.Series(). Pass a list to this function and, if you want, some specific indices. The result can be seen in the picture on the left-hand side.
Note that Series can hold any data type.
To create DataFrames, two-dimensional structures that have columns of different data types, you can use pd.DataFrame(). In this case, you pass a dictionary to this function and some extra indices to specify the columns.
I/O
When you’re using the Pandas library for data wrangling, one of the first things that you won’t do is inventing a DataFrame yourself; Rather, you’ll import data from an external source and you’ll put it in a DataFrame so that it becomes easier to handle. As you have read in the introduction, the ultimate purpose of Pandas is to make real-world data analysis significantly easier.
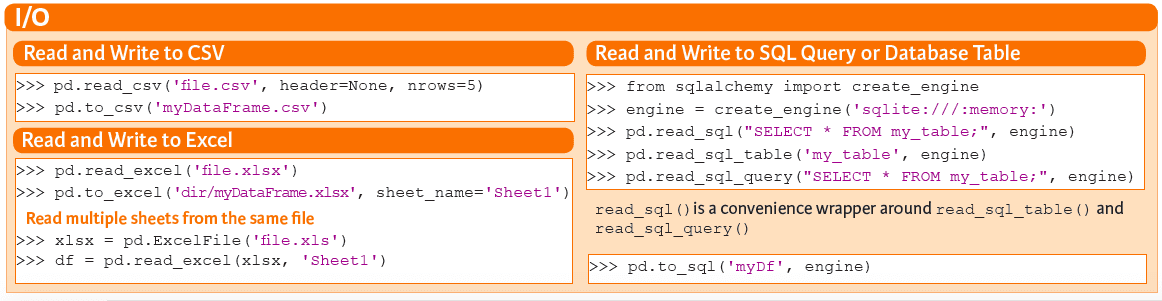
As most of your data won’t necessarily come from text files alone, the cheat sheet includes three ways to input and output your data to DataFrames or files, namely CSV, Excel and SQL Queries/Database Table. These three are considered the three most important ways in which your data comes to you. You’ll see how Pandas has specific functions to pull and push the data in and out these files: pd.read_csv(), pd.read_excel() and pd.read_sql(). But you can also use pd.read_sql_table() or pd.read_sql_query(), depending on whether you’re reading from a table or a query.
Note that to_sql() is a convenience wrapper around the two latter functions. That means that it’s a function that does nothing more than call another function. Likewise, if you want to output your data into files, you make use of pd.to_csv(), pd.to_excel() and pd.to_sql().
Do you want to know more about importing your data with Pandas and using it to explore your data? Consider taking DataCamp’s Pandas Foundations course.
Help!
One of the things that just never seizes to be handy, is the help() function. What you should not forget when you’re using this function is to always be as complete as you can be: if you want to get more information of a function or concept that is included into the Pandas library, such as Series, call pd.Series.

Selection
When you finally have all the information that you need about Series and DataFrames, and you have imported the data into these structures (or maybe you have made your own example Series and DataFrames, just like in the cheat sheet), you might want to inspect the data structures more closely. One of the ways to do this is by selecting elements. As a hint, the cheat sheet indicates that you might also check out how you do this with NumPy arrays. If you already know about NumPy, you clearly have an advantage here!
If you need to get started with this Python library for scientific computing, consider this NumPy tutorial.
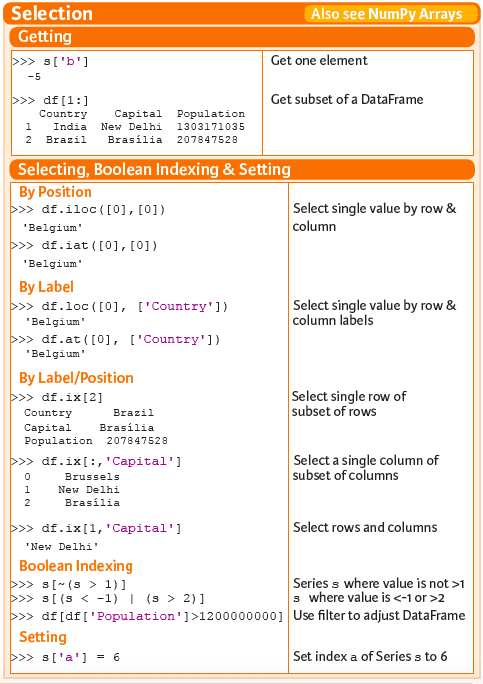
And indeed, the procedure to selection is very similar if you already have worked with NumPy. Don’t worry if you haven’t gotten there yet, because it’s easy: to get one element, you use the square brackets [] and put the desired index to it. In this case, you put ‘b’ in the square brackets and you get back -5. If you look back to the “Pandas Data Structures”, you’ll see that this is correct. A similar thing holds for when you’re working with the 2D DataFrame structure: you use the square brackets in combination with a colon. What you put in front of the colon, is the number to designate the row index; In the second example df[1:], you ask for all the rows, starting at index 1.This means that the row with the Belgium entry will not appear in the result.
To select a value based on its position in the DataFrame or Series, you not only make use of the square brackets in combination with the indices, but you also use the iloc() or iat(). However, you can also select elements by row and column labels. As you have seen before in the introduction of the Pandas data structures, the columns had labels: “Country”, “Capital” and “Population”. With the help of the loc() and at(), you can actually select elements based on these labels. Besides these four functions, there is also an indexer that works on labels or positions: ix is primarily label-based but when no label is provided, it will accept integers to indicate the position in the DataFrame or Series from where you want to retrieve a value.
Boolean indexing is also included in the cheat sheet; It’s an important mechanism to select only values that fulfill a certain condition from your original DataFrame or Series. Conditions can easily be specified with logical operators & or | in combination with the operators <, >, == or combinations, such as <= or >=.
Lastly, there is also the option to set values: in this case, you change the index a of a Series to the value 6 instead of the original value 3.
Are you interested in learning more about how you can manipulate your DataFrames to get the most of them? Consider taking DataCamp’s Manipulating DataFrames with Pandas course.
Dropping Values
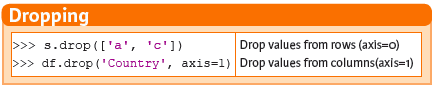
Besides getting, selecting, indexing and setting your DataFrame or Series values, you will also need the flexibility to drop values if you no longer need them. Make use of the drop() to drop values from columns or rows. The default axis that is affected by this functions is the axis 0 or the rows. That means that if you want to remove values from columns, you shouldn’t forget to add the argument axis=1 to your code!
Sorting & Ranking
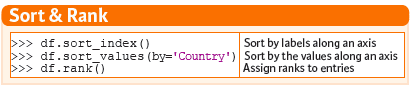
Another way to manipulate your DataFrame or Series is to sort and/or rank the values that are included in the data structures. Use sort_index() to sort by labels along an axis or sort_values() to sort by values along an axis. As you would have expected, rank() allows you to rank entries of your DataFrame or Series.
Retrieving DataFrame/Series Information
When you have finally gotten hold on data for your data science project, it might be handy to know some basic information about your DataFrames or Series, especially when that information can tell you more about the shape, the indices, columns and the number of non-NA values. Also any other information that you can get through info()will be more than welcome when you’re working with data that is unfamiliar or new to you.
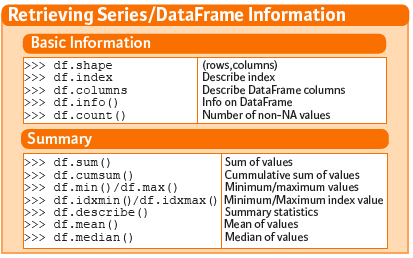
Next to the attributes and functions that you see on the left-hand side, you can also make use of aggregate functions to get to know your data. You’ll see that most of them should look familiar to you as functions that are frequently used in statistics, such as mean() or median().
Applying Functions
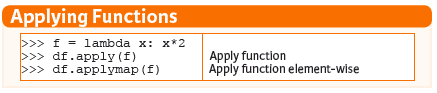
In some cases, you’ll also want to apply functions to your DataFrames or Series. Besides the lambda functions, which you might already know from DataCamp’s Python Data Science Toolbox course , you can also use apply() to apply a function to the whole set of your data or applymap(), in cases where you want to apply the function element-wise. In other words, you’ll apply the function on each element of your DataFrame or Series. Do you want to see some examples on how this works in practice? Try out DataCamp’s Pandas DataFrame tutorial.
Data Alignment
The last thing that you need to know to get started with Pandas is how your data gets handled when your indices are not syncing up. In the example that the cheat sheet gives, you see that the indices of s3 aren’t equal to the ones your Series s has.
This could happen very often!
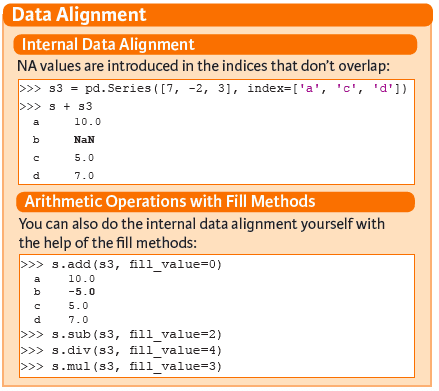
What Pandas does for you in such cases is introduce NA values in the indices that don’t overlap. Whenever this happens, you could pass a fill_value argument to the arithmetic function that you make use of, so that any NA values are replaced with a meaningful alternative value.
Now that you have seen the separate components that make up the basics of Pandas, click the image below to access the full cheat sheet.
DataCamp is an online interactive education platform that that focuses on building the best learning experience specifically for Data Science. Our courses on R, Python and Data Science are built around a certain topic, and combine video instruction with in-browser coding challenges so that you can learn by doing. You can start every course for free, whenever you want, wherever you want.
Bio: Karlijn Willems is a data science journalist and writes for the DataCamp community, focusing on data science education, the latest news and the hottest trends. She holds degrees in Literature and Linguistics and Information Management.
Related: