Insights from Data mining of Airbnb Listings
AirBnB has 2 million listings and operates in 65,000 cities. Here we look at insights related to vacation rental space in the sharing economy using the property listings data for Texas, US.
By Preetish Panda, promptcloud.
Airbnb’s growth has been phenomenal over the years and they are one of hottest unicorn startups in the present days. In fact, they have become profitable and hopefully, looking at IPO in the near future. According to popular media outlets, currently Airbnb has more than 2 million listings in 192 countries and operating in 65,000 cities. Considering the amount of data that Airbnb hosts, it’d be interesting to perform analyses and uncover insights related to vacation rental space in the sharing economy.
In this study we’ll be using the property listings data extracted for Texas, United States. Here are the data fields of the dataset:
- Rate per night
- Number of bedrooms
- City
- Joining month and year
- Longitude
- Latitude
- Property description
- Property title
- Property URL
You can download this dataset from our Kaggle page.
There are two goals of this study:
- The goal of our analyses would be to plot the pricing data in terms of density and expensiveness on the Texas map
- We’d also perform topic modelling on the description text of the property listings
Spatial Analysis
Let’s first try to visualize the property density across cities of Texas and find out which one has maximum number of listings. Given below is the `R` code to create the contour heat map:
#Load the library
library(ggmap)

#Create Texas map
tx_map = get_map(location = "texas", zoom = 6)

#Load the dataset from the CSV file
tx_bnb_data = read.csv(file.choose(), stringsAsFactors = FALSE)

# Create the heat map
ggmap(tx_map, extent = "device") +
geom_density2d(data = tx_bnb_data, aes(x = longitude, y =latitude),
  size = 0.3) +
stat_density2d(data = tx_bnb_data, aes(x = longitude, y = latitude,
fill = ..level.., alpha = ..level..), size = 0.01,
bins = 16, geom = "polygon") +
scale_fill_gradient(low = "black", high = "red",name = "Density") +
scale_alpha(range = c(0,0.3), guide = FALSE) +
ggtitle("Density Distribution of Airbnb Properties in Texas")
You should be able to generate the following heat map:
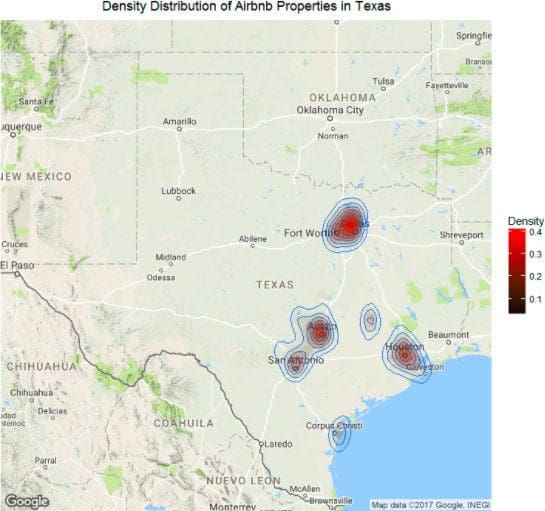
We can see that Dallas and Fort Worth area sit at the top in terms of property density, closely followed by Houston and Austin. But, what about the expensiveness of the properties? Is that different from this visualization? Let’s find out.
This dataset contains longitude and latitude of each listing along with pricing. We’ll use these data points to plot pricing on Texas map. It’ll have circles on each of the location clusters (cities) and size of these circles would signify increase in price. Here is the `R` code:
#Select properties with 1/2/3 bedrooms

tx_bnb_data_new <- tx_bnb_data[(tx_bnb_data$bedrooms_count=="1" |
  tx_bnb_data$bedrooms_count=="2" | tx_bnb_data$bedrooms_count=="3") , ]

#Remove the dollar symbol in the price column

tx_bnb_data_new$average_rate_per_night <- as.numeric(gsub("[\\$,]", "",
  tx_bnb_data_new$average_rate_per_night))

#Set the circle size for price

tx_circle_size <- 0.005

#Create the heat map

ggmap(tx_map, extent = "device") + geom_point(aes(x=longitude, y=latitude),
  data=tx_bnb_data_new, col="purple", alpha=0.1,
  size=tx_bnb_data_new$average_rate_per_night*tx_circle_size) +
  scale_size_continuous(range=range(tx_bnb_data_new$average_rate_per_night)) +
  ggtitle("Expensiveness of Airbnb Properties in Texas")
Now, you should be able to create the following visualization:
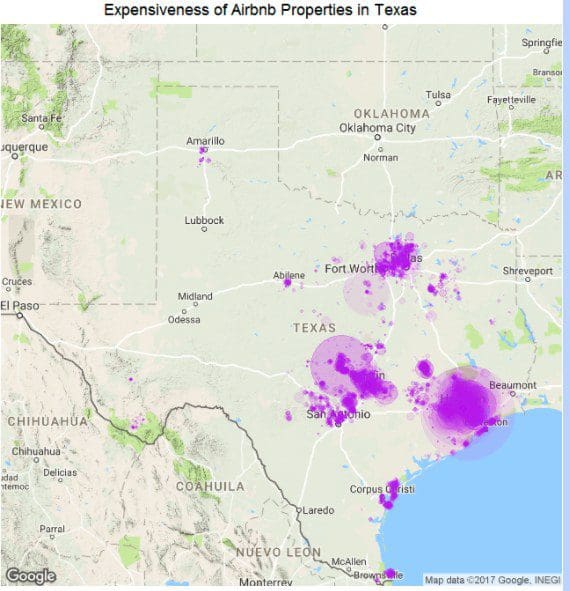
We can see that although Houston doesn’t top in terms of property density, it houses some of the most expensive rental places. Other places that are next in line are properties close to Austin and Fort Worth.
Top Modelling
This is a technique used in text mining to uncover latent pattern in large collections of textual data. Essentially, topic modelling finds topics that are created by group of words present in large collection of text -- words constitute topics and topics create documents. Key aspect of this technique is that it takes an unsupervised approach ensuring that the final outcome of the analysis (groups of words in the topics) will not be known to the analyst. Application of this topic modelling lies in creation of documents clusters, annotations, organization of text data and search. In this study we’ll deploy one of the most widely accepted techniques called LDA (Latent Dirichlet Analysis) to analyze the description of the properties. Check out the article on KDnuggets to learn more about topic modelling and LDA.
In our case, I have tried to fit the model into four topics using the method released by Julia Silge. Here is the `R` code:
#Load the libraries
library(tm)
library(topicmodels)
library(tidytext)
library(ggplot2)
library(magrittr)
library(dplyr)
library(stringr)

#Get the property descriptions
tx_prop_desc = tx_bnb_data$description

#Create text corpus
tx_desc_corpus = Corpus(VectorSource(tx_prop_desc))

#Converting to lowercase and removing problematic symbols
tx_desc_corpus = tm_map(tx_desc_corpus,content_transformer(tolower))
toSpace = content_transformer(function(x, pattern) {
                return (gsub(pattern," ", x))})
tx_desc_corpus = tm_map(tx_desc_corpus, toSpace, "-")
tx_desc_corpus = tm_map(tx_desc_corpus, toSpace, "’")
tx_desc_corpus = tm_map(tx_desc_corpus, toSpace, "‘")
tx_desc_corpus = tm_map(tx_desc_corpus, toSpace, "•")
tx_desc_corpus = tm_map(tx_desc_corpus, toSpace, "”")
tx_desc_corpus = tm_map(tx_desc_corpus, toSpace, "“")

#Remove punctuation
tx_desc_corpus = tm_map(tx_desc_corpus, removePunctuation)

#Strip numbers
tx_desc_corpus = tm_map(tx_desc_corpus, removeNumbers)

#Remove stopwords
tx_desc_corpus = tm_map(tx_desc_corpus, removeWords, stopwords("english"))
tx_desc_corpus = tm_map(tx_desc_corpus, removeWords, c("amp"))

#Remove whitespace
tx_desc_corpus = tm_map(tx_desc_corpus, stripWhitespace)
#Create document-term matrix
tx_dtm = DocumentTermMatrix(tx_desc_corpus)

#Remove empty documents from the document-term matrix
unique_indices = unique(tx_dtm$i)
tx_dtm = tx_dtm[unique_indices,]
#Fitting a topic model
desc_lda = LDA(tx_dtm, k = 4, control = list(seed = 1234))
#Performing tidy analysis
tidy_lda = tidy(desc_lda)
#Finding top terms in each model
top_terms = tidy_lda %>%
  group_by(topic) %>%
  top_n(5, beta) %>%
  ungroup() %>%
  arrange(topic, -beta)
#Creating visualization of the topics
top_terms %>%
  mutate(topic = factor(topic, labels = str_c("topic ", 1:4)),
         term = reorder(term, beta)) %>%
  group_by(topic, term) %>%
  arrange(desc(beta)) %>%
  ungroup() %>%
  mutate(term = factor(paste(term, topic, sep = "__"),
                       levels = rev(paste(term, topic, sep = "__")))) %>%
  ggplot(aes(term, beta, fill = as.factor(topic))) +
  geom_col(show.legend = FALSE) +
  coord_flip() +
  scale_x_discrete(labels = function(x) gsub("__.+$", "", x),
                   expand = c(0,0)) +
  scale_y_continuous(expand = c(0,0)) +
  labs(title = "Top terms in each LDA topic",
  x = NULL, y = expression(beta)) +
  facet_wrap(~ topic, ncol = 2, scales = "free")
Now you should be able to see the chart of the topics along with the β value, which is the probability of the term being generated from that topic.
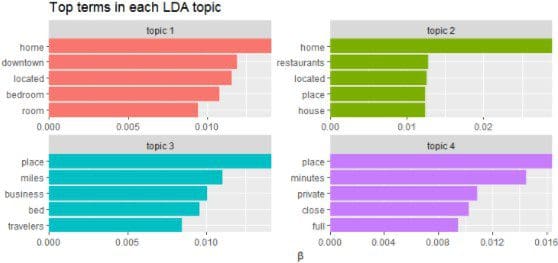
We can see that the topics generated by the model comprise of certain words. `Topic 1` has word related to downtown (city center area) while `topic 2` is related to restaurants. `Topic 3` and `topic 4` are inclined towards business travellers and privacy respectively.
Conclusion
In this study we performed spatial analysis by plotting data on the map of Texas with respect to property density and pricing. Then we moved to topic modelling by LDA approach in which we tried to figure out hidden pattern in the property descriptions. Much more can be analyzed using this data -- download the dataset using the link given above and uncover interesting insights.
Note: The Airbnb data required for this analysis was extracted by PromptCloud’s Data-as-a-Service solution.
Bio: Preetish Panda is Marketing Manger at PromptCloud.
Related: