 Data Science at the Command Line: Exploring Data
 Data Science at the Command Line: Exploring Data
See what's available in the freely-available book "Data Science at the Command Line" by digging into data exploration in the terminal.
 The tools for data science are many and varied, and span a variety of ecosystems. Python and R tend to be some of the more popular programming environments, but there are many other options, including a plethora of programming and scripting languages, GUI- and web-based tools.
One of the less considered modes of attack is a strictly command line approach. Sure, you use the command line to execute your Python scripts, or run your C program, or invoke your R environment... or whatever else you might do with it. But what about running the entire show from the terminal?
Answering that question is Jeroen Janssens, the author of the now freely-available book "Data Science at the Command Line." From the book's website:
This hands-on guide demonstrates how the flexibility of the command line can help you become a more efficient and productive data scientist. You’ll learn how to combine small, yet powerful, command-line tools to quickly obtain, scrub, explore, and model your data.
...
Discover why the command line is an agile, scalable, and extensible technology. Even if you’re already comfortable processing data with, say, Python or R, you’ll greatly improve your data science workflow by also leveraging the power of the command line.
Aside from writing a thorough survey of command line tools for doing data science, Jeroen has also put together a Docker image with over 80 related tools, those which are covered within the book.
Chapter 7 of "Data Science at the Command Line" is titled "Exploring Data," focusing on using command line tools at the third step of the OSEMN model.
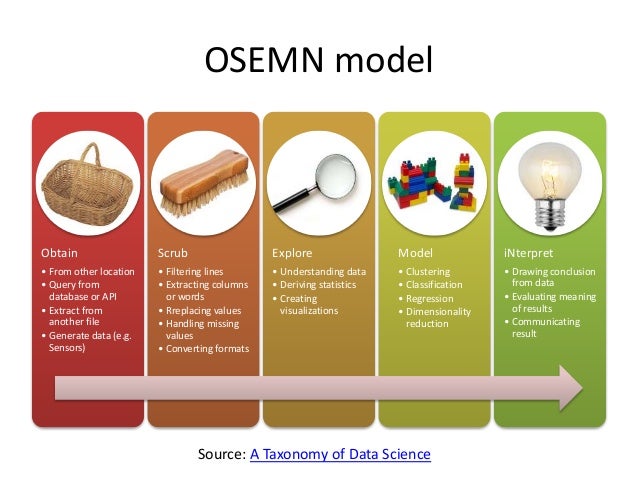
OSEMN model (source).
Exploring your data can be done from three perspectives. The first perspective is to inspect the data and its properties. Here, we want to know, for example, what the raw data looks like, how many data points the data set has, and what kind of features the data set has.
The second perspective from which we can explore out data is to compute descriptive statistics. This perspective is useful for learning more about the individual features. One advantage of this perspective is that the output is often brief and textual and can therefore be printed on the command line.
The third perspective is to create visualizations of the data. From this perspective we can gain insight into how multiple features interact. We’ll discuss a way of creating visualizations that can be printed on the command line. However, visualizations are best suited to be displayed on a graphical user interfaces. An advantage of visualizations over descriptive statistics is that they are more flexible and that they can convey much more information.
Here's a quick taste of what you can accomplish exploring data at the command line.
First, you will need to install python3-csvkit:
$ sudo apt install python3-csvkit
Then, download a CSV file to play with:
$ wget https://raw.githubusercontent.com/uiuc-cse/data-fa14/gh-pages/data/iris.csv
We can print the first few lines of iris.csv with head:
$ head iris.csv

sepal_length,sepal_width,petal_length,petal_width,species
5.1,3.5,1.4,0.2,setosa
4.9,3,1.4,0.2,setosa
4.7,3.2,1.3,0.2,setosa
4.6,3.1,1.5,0.2,setosa
5,3.6,1.4,0.2,setosa
5.4,3.9,1.7,0.4,setosa
4.6,3.4,1.4,0.3,setosa
5,3.4,1.5,0.2,setosa
4.4,2.9,1.4,0.2,setosa
Handy. But with csvlook (part of python3-csvkit), you get something a bit more tabular:
$ head iris.csv | csvlook

|---------------+-------------+--------------+-------------+----------|
|  sepal_length | sepal_width | petal_length | petal_width | species  |
|---------------+-------------+--------------+-------------+----------|
|  5.1          | 3.5         | 1.4          | 0.2         | setosa   |
|  4.9          | 3           | 1.4          | 0.2         | setosa   |
|  4.7          | 3.2         | 1.3          | 0.2         | setosa   |
|  4.6          | 3.1         | 1.5          | 0.2         | setosa   |
|  5            | 3.6         | 1.4          | 0.2         | setosa   |
|  5.4          | 3.9         | 1.7          | 0.4         | setosa   |
|  4.6          | 3.4         | 1.4          | 0.3         | setosa   |
|  5            | 3.4         | 1.5          | 0.2         | setosa   |
|  4.4          | 2.9         | 1.4          | 0.2         | setosa   |
|---------------+-------------+--------------+-------------+----------|
Much nicer. Want to look at the entire file? While I have always piped the output of cat into more:
$ cat iris.csv | more
... Jeroen advocates using less, a more versatile command line tool that operates in the style of the vi text editor. It allows for moving around within the text file using a series of single key commands. Give it a try ('q' is for quit when you are finished looking):
$ iris.csv csvlook | less -S
Want to know the dataset's attribute names? Easy, with the special editor sed:
$ < iris.csv sed -e 's/,/\n/g;q'

sepal_length
sepal_width
petal_length
petal_width
species
Great. What about more attribute metadata?
$ csvstat iris.csv 1. sepal_lengthNulls: False Min: 4.3 Max: 7.9 Sum: 876.5000000000002 Mean: 5.843333333333335 Median: 5.8 Standard Deviation: 0.8253012917851412 Unique values: 35 5 most frequent values: 5.0: 10 6.3: 9 5.1: 9 6.7: 8 5.7: 8 ...
How about something like unique attribute value counts within the dataset?
$ csvstat iris.csv --unique

  1. sepal_length: 35
  2. sepal_width: 23
  3. petal_length: 43
  4. petal_width: 22
  5. species: 3
Depending on how comfortable or reliant you are on the command line (or are willing to become), you can delve into more advanced concepts such as creating bash scripts with numerous commands working in sequence. This, however, moves from "command line" data science into the more familiar realm of scripting, but with bash instead of, for example, Python. You could also do something in between, such as creating a library of bash snippets as functions and adding them to your .bashrc config file, in order to call them from the command line repetitively on different data. The possibilities are limited only by your imagination and skill.
This is just a taste of what you can find in Chapter 7 of "Data Science at the Command Line," which, in turn, only touches on the wealth of information that the book holds.
Regardless of how you look at it, having command line skills at your disposal are invaluable. In that vein, you should give this book a chance.
Related:
- 7 Steps to Mastering Data Preparation with Python
- A General Approach to Preprocessing Text Data
- Exploratory Data Analysis in Python