Big Idea To Avoid Overfitting: Reusable Holdout to Preserve Validity in Adaptive Data Analysis
Big Data makes it all too easy find spurious "patterns" in data. A new approach helps avoid overfitting by using 2 key ideas: validation should not reveal any information about the holdout data, and adding of a small amount of noise to any validation result.
By Vitaly Feldman (IBM Almaden Research Center). Republished from IBM Research blog.
From discovering new particles and clinical studies to predicting election results and evaluating credit score, scientific progress and industrial innovation increasingly rely on statistical data analysis. While incredibly useful, data analysis is also notoriously easy to misuse, even when the analyst has the best of intentions. Problems stemming from such misuse can be very costly and have contributed to a wider concern about the reproducibility of research findings, most notably in medical research. The issue is hotly debated in the scientific community and has attracted a lot of public attention in the recent years.
In recent research with a team of computer scientists from industry and academia, I made progress in understanding and addressing some of the ways in which data analysis can go wrong. Our work, published recently in Science, deals with important, but fairly technical and subtle, statistical issues that arise in the practice of data analysis. I’ll outline them below. For the less patient there is watch an elevator-pitch description (minus the elevator) of this work below.
The main difficulty in obtaining valid results is that it is hard to tell whether a pattern observed in the data represents a true relationship that holds in the real world or is merely a coincidental artifact of the randomness in the process of data collection. The standard way of expressing the confidence in a result of analysis -- such as a certain trait being correlated with a disease -- is a p-value. Informally, a p-value for a certain result measures the probability of obtaining the result in the absence of any actual relationship (referred to as the null hypothesis). A small p-value indicates high confidence in the validity of the result, with 0.05 commonly accepted as sufficient to declare a finding as being statistically significant.
The guarantee that a p-value provides has a critical caveat however: It applies only if the analysis procedure was chosen before the data was examined. At the same time, the practice of data analysis goes well beyond using a predetermined analysis: New analyses are chosen on the basis of data exploration and previous analyses of a dataset and are performed on the same dataset. While very useful, such adaptive analysis invalidates the standard p-value computations. Using incorrect p-values is likely to lead to false discoveries. An analyst might conclude, for example, that a certain diet increases the risk of diabetes, when in reality it has no effect at all.
The mistakes that misapplications of standard p-value computations cause can be easily observed using any basic data analysis tool. For example, let’s create a fake dataset for a study of the effect of 50 different foods on the academic performance of students. For each student the data will include a consumption level for each of the 50 foods and an (academic) grade. Let’s create the dataset consisting of 100 students by choosing all the values randomly and independently from the normal (or Gaussian) distribution.
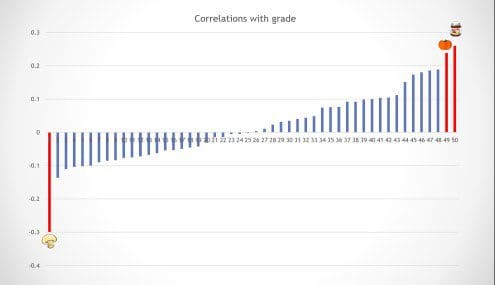
Clearly, in the true data distribution we used the food consumption and the students’ grade are completely unrelated. A natural first step in our analysis of this dataset is to identify which foods have the highest (positive or negative) correlation with the grade. Below is an example outcome of this step in which I have highlighted in red three foods with particularly strong correlations in the data.
A common next step would be to use the least-squares linear regression to check whether a simple linear combination of the three strongly correlated foods can predict the grade. It turns out that a little combination goes a long way: We discover that a linear combination of the three selected foods can explain a significant fraction of variance in the grade (plotted below). The regression analysis also reports that the p-value of this result is 0.00009 meaning that the probability of this happening purely by chance is less than 1 in 10,000.
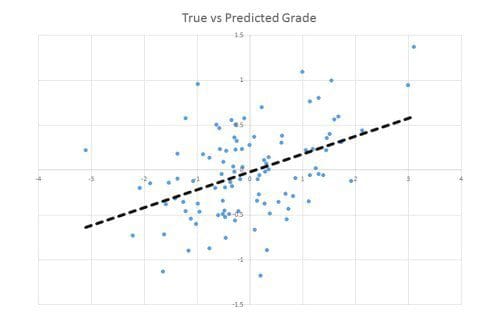
Recall that no relationship exists in the true data distribution, so this discovery is clearly false. This spurious effect is known to experts as Freedman’s paradox. It arises since the variables (foods) used in the regression were chosen using the data itself.
Despite the fundamental nature of adaptivity in data analysis little work has been done to understand and mitigate its effects on the validity of results. The only known “safe” approach to adaptive analysis is to use a separate holdout dataset to validate any finding obtained via adaptive analysis. Such an approach is standard in machine learning: A dataset is split into training and validation data, with the training set used for learning a predictor, and the validation (holdout) set used to estimate the accuracy of that predictor. Because the predictor is independent of the holdout dataset, such an estimate is a valid estimate of the true prediction accuracy. In practice, however, the holdout dataset is rarely used only once and the predictor often depends on the holdout data in a complicated way. Such dependence invalidates the estimates of accuracy based on the holdout set as the predictor may be overfitting to the holdout set.
I’ve been working on approaches for dealing with adaptivity in machine learning for the past two years. During a chance conversation with Aaron Roth (University of Pennsylvania) at a big data and privacy workshop, I found out that he and several colleagues were also working on an approach to this problem. That conversation has turned into a fruitful collaboration with Cynthia Dwork (Microsoft Research), Moritz Hardt (Google Research), Toni Pitassi (University of Toronto), Omer Reingold and Aaron.
We have found that challenges of adaptivity can be addressed using techniques developed for privacy-preserving data analysis. These techniques rely on the notion of differential privacy that guarantees that the data analysis is not too sensitive to the data of any single individual. We have demonstrated rigorously that ensuring differential privacy of an analysis also guarantees that the findings will be statistically valid. We have also developed additional approaches to the problem based on a new way to measure how much information an analysis reveals about a dataset.
Using our new approach we designed an algorithm, called Thresholdout, that allows an analyst to reuse the holdout set of data for validating a large number of results, even when those results are produced by an adaptive analysis. The Thresholdout algorithm is very easy to implement and is based on two key ideas.