A simple approach to anomaly detection in periodic big data streams
We describe a simple and scaling algorithm that can detect rare and potentially irregular behavior in a time series with periodic patterns. It performs similarly to Twitter's more complex approach.
By Simon Kern & Richard Zinck, BMW.
One of the signature traits of big data is that large volumes are created in short periods of time. This data often comes from connected devices, such as mobile phones, vehicle fleets or industrial machinery. The reasons for generating and observing this data are many, yet a common problem is the detection of anomalous behaviour. This may be a machine in a factory that is on the verge of malfunctioning, say due to the imminent breaking of some part, or a member of a vehicle fleet that has experienced unusual or hazardous environmental conditions.
Monitoring data is one way to detect such problems early by identifying irregular behavior. Early detection allows for intervention, often reducing the cost of a malfunction. The entire proposition hinges on the idea that it is possible to separate normal from irregular behavior with a high degree of confidence. As in any classification problem, errors can be made in at least two ways: a normal behavior can be identified as irregular or an irregular behavior not detected.
Here, we use a simple algorithm that can detect rare and potentially irregular behavior in a time series that has periodic patterns (inspired by 2. ). The pattern may arise from differences in utilization of a service during the day, as well as patterns depending on the weekday. Recently, Twitter released an open source implementation for detecting anomalies in such time series using GNU R. The algorithm combines a series of sophisticated procedures to model periodicity and smoothing. The periodicity is extracted and rare events are identified against a normalized distribution.
Our solution uses structural knowledge about the system, combined with the data, to identify timespans where similar behavior is expected. This is used as a basis for aggregating data within comparable periods, consisting e.g. of business days. The aggregation is discretized into time slices that are small enough to capture a gradient, yet not so small that we do not have enough data per time slot. The initial discretization scheme is based on an educated guess. Nevertheless, an optimal discretization provided the data can be determined e.g. using simulated annealing or a Markov Chain Monte Carlo procedure.
In the case presented here, we segmented the week into weekdays and weekends. Each segment is then broken down into an hourly statistic for our observable. In each such tuple of (type of day, hour) we have a number of measurements from previous weeks. The distribution within these bins can then be used to identify rare events. With our data, the distributions have a dominant mode and we hence use a normal distribution as a model to identify rare events. This can be achieved efficiently by calculating a running mean and standard deviation for each tuple. If a new data point is considered a potential anomaly if it lies outside of the range of a specified multiple of the standard deviation within its bin. The periodicity is captured by the segmentation and discretization. Global trends can be captured by restricting the memory in the calculation of the running statistics. Popular choices are exponentially smoothed statistics, such that the value of an older data point enters the aggregated statistic with a lesser weight.
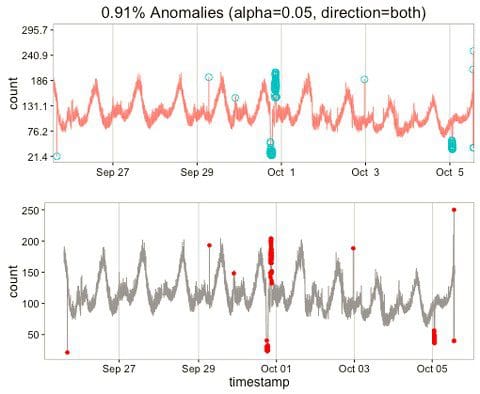
We tested this simple anomaly detection algorithm against the data provided in the open source Twitter library and the exact same points were classified as anomalies ( abs(value - mean) >= 2.5 * standard deviation, see Figure 1). In the twitter example, the data are binned in minutes and every weekday is assumed to have the same pattern. We modified our algorithm to work with these assumptions.
The question remains valid why not to use the library provided by Twitter. We are using it - as one of our benchmarks. Nevertheless, we want our solution to work in a big data environment, and libraries in GNU R do not scale well. Hence, we used Apache Spark/Spark streaming to implement our solution. Furthermore, Twitter's approach combines several algorithms that introduce a high degree of complexity, such as fitting a polygon to the data to model periodicity. Each of these procedures introduces potential sources of errors and makes the result more difficult to interpret. So, as long as we get no advantage from the more complex algorithm, we will stick to the simple, scalable solution.
Next, we plan to use methods from unsupervised learning to identify anomalous combinations of a set of observables. A problem in the operation of machinery or a fleet may result in an odd combination of signals. By using unsupervised learning techniques, we can identify vectors of observables that are outside of the boundary of clusters identified in normal behavior.
It is our intention to make the resulting software available under an open source license, so stay tuned.
References
1. Introducing practical and robust anomaly detection in a time series, Twitter blog
2. Data Science tricks: Simple anomaly detection for metrics with a weekly pattern
Bio: Simon Kern is a software developer with strong expertise in scalable data stream processing. Dr. Richard Zinck is a senior data scientist. Both work at BMW Car IT GmbH in Munich.