Understanding the Empirical Law of Large Numbers and the Gambler’s Fallacy
Law of large numbers is a important concept for practising data scientists. In this post, The empirical law of large numbers is demonstrated via simple simulation approach using the Bernoulli process.
By Mehmet Suzen, Alumni Frankfurt Institute for Advanced Studies.
One of the misconceptions in our understanding of statistics, or a counter-intuitive guess, fallacy, appears in the assumption of the existence of the law of averages. Imagine we toss a fair coin many times, most people would think that the number of heads and tails would be balanced over the increasing number of trails, which is wrong. If you don't, then you might have a very good statistical intuition. Briefly, we will illustrate this, a kind of gambler's fallacy with a simple simulation approach and discuss the empirical law of large numbers.
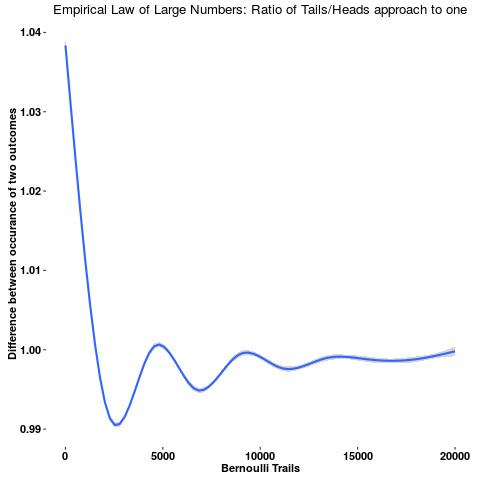
Figure 1: Empirical law of large numbers, ratio of occurrences approach to a constant.
Empirical law of large numbers
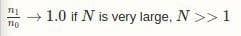
If we repeat an experiment long enough, we would approach to expected outcome. The simplest example is a coin-toss experiment, that an expected fair coin toss would lead to equal likelihood for head and tail, 1 or 0. This implies that, the ratio of head and tails will approach to one with increasing number of repeats. Let's say, we toss the coin N times. The number of heads and tails would be n1 and n0. The empirical law of large numbers states
But note that, the absolute difference, | n1 − n0 | does not approach to any constant, on the contrary, it will increase with increasing number of repeats. This is classic example of gambler's fallacy that an outcome would balance out as there are more repeats.
Fair coin-toss: Evolution of Bernoulli process
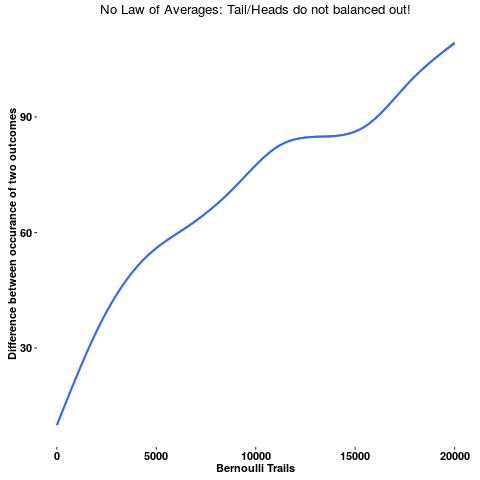
Figure 2: No low of averages. Absolute difference of occurrences increases over repeats.
The Bernoulli process expresses binary outcomes, 1 or 0, i.e., success or failure, true or false. Bernoulli distribution reads,
p is the probability of success. We draw 50K samples from this distribution to get a Bernoulli process with p=0.5 and repeat the experiment 50 times, in order to obtain a "generalised" behaviour with uncertainty. This situation corresponds to a fair coin-toss experiment.
Results
Empirical results of ratio of two outcomes and their absolute difference over repeats are reported in Figure 1 and 2 respectively.
Appendix: Source codes
R and Rcpp functions are shown in this section to reproduce the plots in this post. Source files are also available on github (here).
Click here to view the referenced code.
Bio: Mehmet Suzen is a Data Scientist based in London, he comes from Physics background.
Original. Reposted with permission.
Related: