Understanding Supervised Learning: Theory and Overview
This article covers a high-level overview of popular supervised learning algorithms and is curated specially for beginners.
Image by Author
Supervised is a subcategory of machine learning in which the computer learns from the labeled dataset containing both the input as well as the correct output. It tries to find the mapping function that relates the input (x) to the output (y). You can think of it as teaching your younger brother or sister how to recognize different animals. You will show them some pictures (x) and tell them what each animal is called (y). After a certain time, they will learn the differences and will be able to recognize the new picture correctly. This is the basic intuition behind supervised learning. Before moving forward, let's take a deeper look at its workings.
How Does Supervised Learning Work?
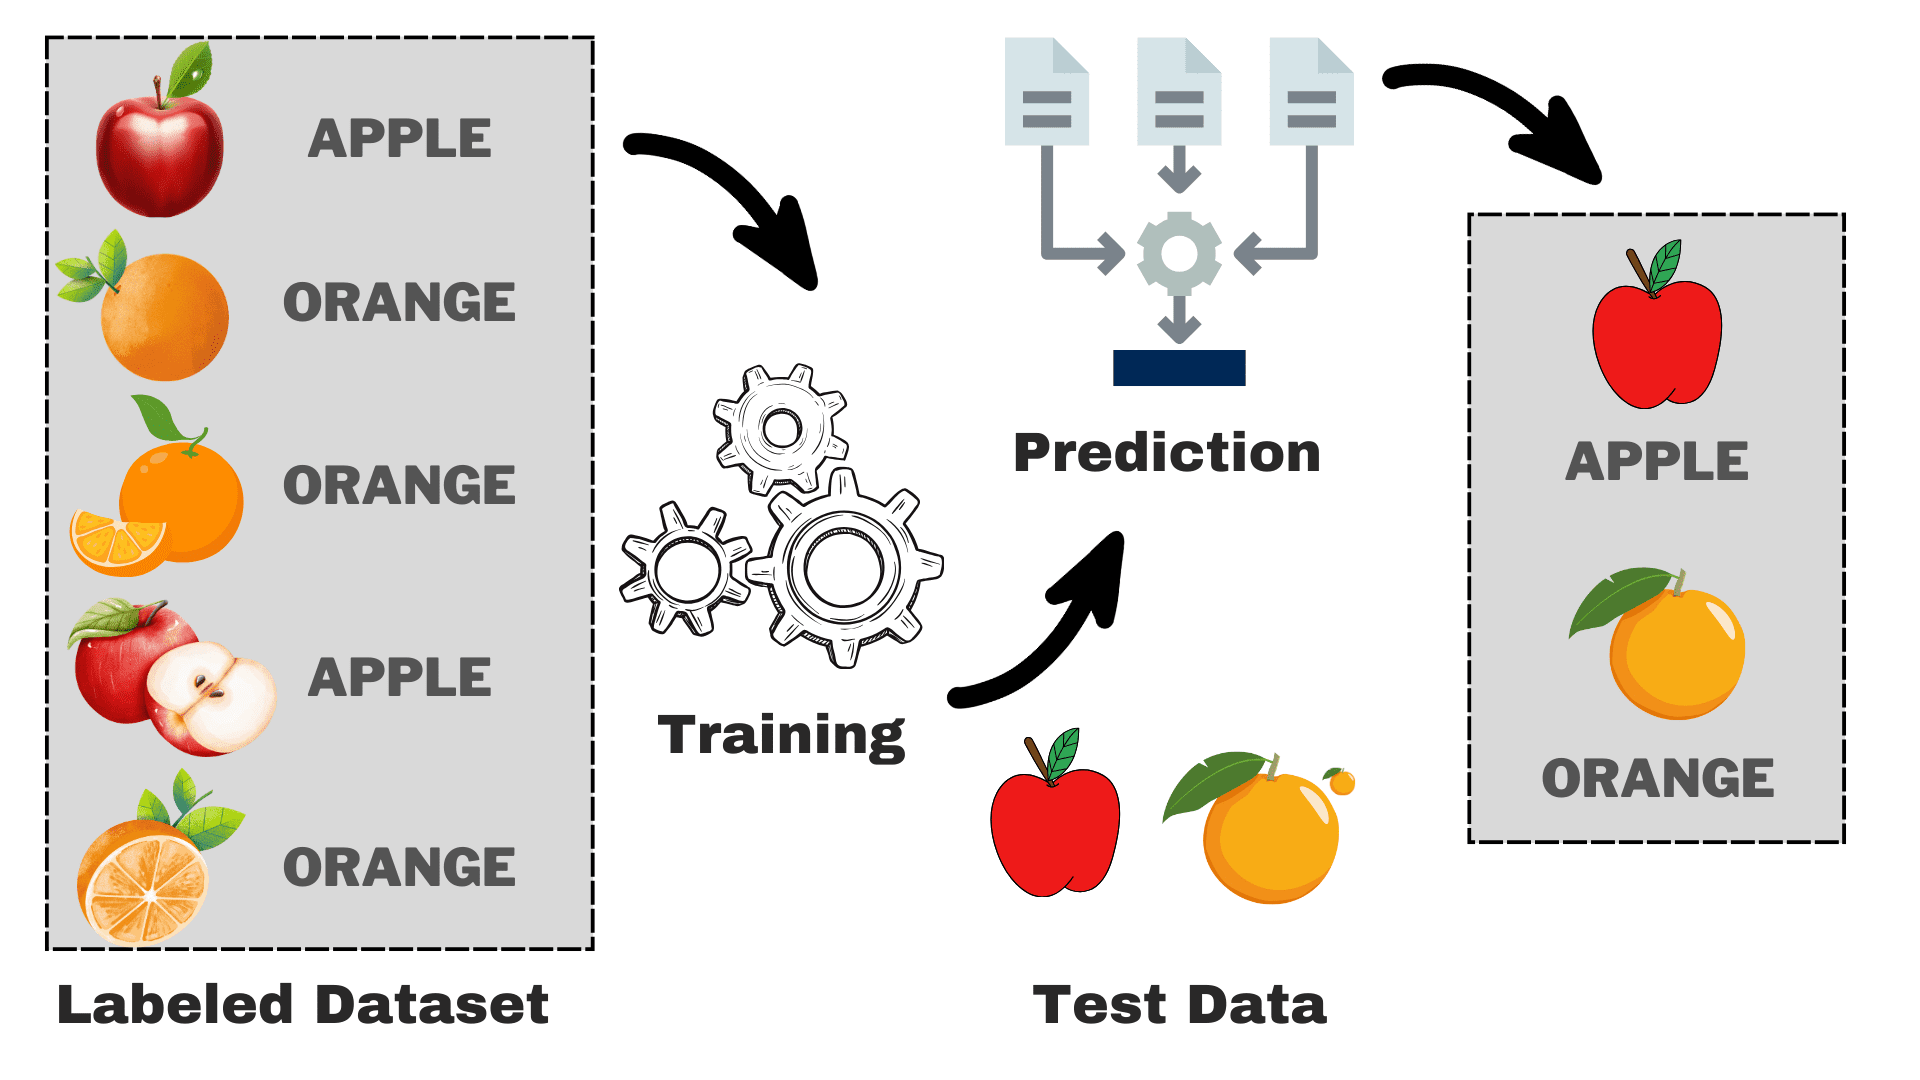
Image by Author
Suppose that you want to build a model that can differentiate between apples and oranges based on some characteristics. We can break down the process into the following tasks:
- Data Collection: Gather a dataset with pictures of apples and oranges, and each image is labeled as either "apple" or "orange."
- Model Selection: We have to pick the right classifier here often known as the right supervised machine learning algorithm for your task. It is just like picking the right glasses that will help you see better
- Training the Model: Now, you feed the algorithm with the labeled images of apples and oranges. The algorithm looks at these pictures and learns to recognize the differences, such as the color, shape, and size of apples and oranges.
- Evaluating & Testing: To check if your model is working correctly, we will feed some unseen pictures to it and compare the predictions with the actual one.
Types of Supervised Learning
Supervised learning can be divided into two main types:
Classification
In classification tasks, the primary objective is to assign data points to specific categories from a set of discrete classes. When there are only two possible outcomes, such as "yes" or "no," "spam" or "not spam," "accepted" or "rejected," it is referred to as binary classification. However, when there are more than two categories or classes involved, like grading students based on their marks (e.g., A, B, C, D, F), it becomes an example of a multi-classification problem.
Regression
For regression problems, you are trying to predict a continuous numerical value. For example, you might be interested in predicting your final exam scores based on your past performance in the class. The predicted scores can span any value within a specific range, typically from 0 to 100 in our case.
Overview of Popular Supervised Learning Algorithms
Now, we have a basic understanding of the overall process. We will explore the popular supervised machine learning algorithms, their usage, and how they work:
1. Linear Regression
As the name suggests, it is used for regression tasks like predicting stock prices, forecasting the temperature, estimating the likelihood of disease progression, etc. We try to predict the target (dependent variable) using the set of labels (independent variables). It assumes that we have a linear relationship between our input features and the label. The central idea revolves around predicting the best-fit line for our data points by minimizing the error between our actual and predicted values. This line is represented by the equation:

Where,
- Y Predicted output.
- X = Input feature or feature matrix in multiple linear regression
- b0 = Intercept (where the line crosses the Y-axis).
- b1 = Slope or coefficient that determines the line's steepness.
It estimates the slope of the line (weight) and its intercept(bias). This line can be used further to make predictions. Although it is the simplest and useful model for developing the baselines it is highly sensitive to outliers that may influence the position of the line.
Gif on Primo.ai
2. Logistic Regression
Although it has regression in its name, but is fundamentally used for binary classification problems. It predicts the probability of a positive outcome (dependent variable) which lies in the range of 0 to 1. By setting a threshold (usually 0.5), we classify data points: those with a probability greater than the threshold belongs to the positive class, and vice versa. Logistic regression calculates this probability using the sigmoid function applied to the linear combination of the input features which is specified as:
Where,
- P(Y=1) = Probability of the data point belonging to the positive class
- X1 ,... ,Xn = Input Features
- b0,....,bn = Input weights that the algorithm learns during training
This sigmoid function is in the form of S like curve that transforms any data point to a probability score within the range of 0-1. You can see the below graph for a better understanding.

Image on Wikipedia
A closer value to 1 indicates a higher confidence in the model in its prediction. Just like linear regression, it is known for its simplicity but we cannot perform the multi-class classification without modification to the original algorithm.
3. Decision Trees
Unlike the above two algorithms, decision trees can be used for both classification and regression tasks. It has a hierarchical structure just like the flowcharts. At each node, a decision about the path is made based on some feature values. The process continues unless we reach the last node that depicts the final decision. Here is some basic terminology that you must be aware of:
- Root Node: The top node containing the entire dataset is called the root node. We then select the best feature using some algorithm to split the dataset into 2 or more sub-trees.
- Internal Nodes: Each Internal node represents a specific feature and a decision rule to decide the next possible direction for a data point.
- Leaf Nodes: The ending nodes that represent a class label are referred to as leaf nodes.
It predicts the continuous numerical values for the regression tasks. As the size of the dataset grows, it captures the noise leading to overfitting. This can be handled by pruning the decision tree. We remove branches that don't significantly improve the accuracy of our decisions. This helps keep our tree focused on the most important factors and prevents it from getting lost in the details.
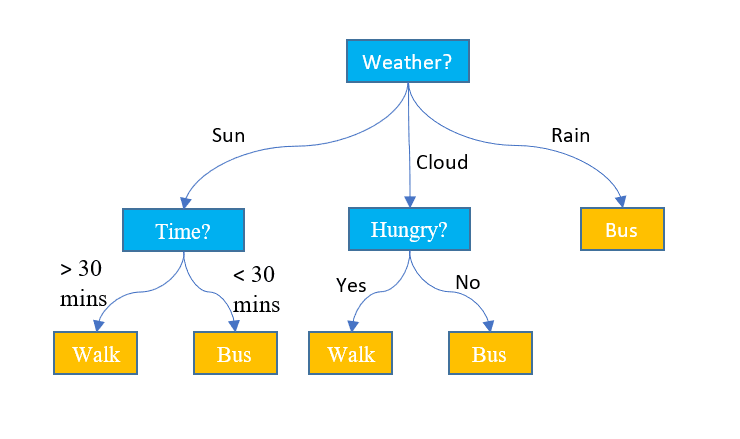
Image by Jake Hoare on Displayr
4. Random Forest
Random forest can also be used for both the classification and the regression tasks. It is a group of decision trees working together to make the final prediction. You can think of it as the committee of experts making a collective decision. Here is how it works:
- Data Sampling: Instead of taking the entire dataset at once, it takes the random samples via a process called bootstrapping or bagging.
- Feature Selection: For each decision tree in a random forest, only the random subset of features is considered for the decision-making instead of the complete feature set.
- Voting: For classification, each decision tree in the random forest casts its vote and the class with the highest votes is selected. For regression, we average the values obtained from all trees.
Although it reduces the effect of overfitting caused by individual decision trees, but is computationally expensive. One word that you will read frequently in the literature is that the random forest is an ensemble learning method, which means it combines multiple models to improve overall performance.
5. Support Vector Machines (SVM)
It is primarily used for classification problems but can handle regression tasks as well. It tries to find the best hyperplane that separates the distinct classes using the statistical approach, unlike the probabilistic approach of logistic regression. We can use the linear SVM for the linearly separable data. However, most of the real-world data is non-linear and we use the kernel tricks to separate the classes. Let's dive deep into how it works:
- Hyperplane Selection: In binary classification, SVM finds the best hyperplane (2-D line) to separate the classes while maximizing the margin. Margin is the distance between the hyperplane and the closest data points to the hyperplane.
- Kernel Trick: For linearly inseparable data, we employ a kernel trick that maps the original data space into a high-dimensional space where they can be separated linearly. Common kernels include linear, polynomial, radial basis function (RBF), and sigmoid kernels.
- Margin Maximization: SVM also tries to improve the generalization of the model by increasing the maximizing margin.
- Classification: Once the model is trained, the predictions can be made based on their position relative to the hyperplane.
SVM also has a parameter called C that controls the trade-off between maximizing the margin and keeping the classification error to a minimum. Although they can handle high-dimensional and non-linear data well, choosing the right kernel and hyperparameter is not as easy as it seems.
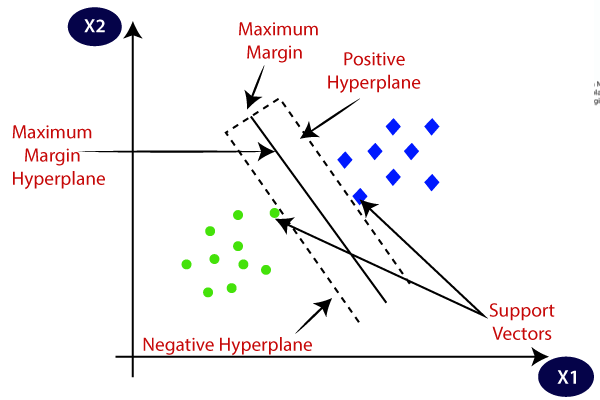
Image on Javatpoint
6. k-Nearest Neighbors (k-NN)
K-NN is the simplest supervised learning algorithm mostly used for classification tasks. It doesn’t make any assumptions about the data and assigns the new data point a category based on its similarity with the existing ones. During the training phase, it keeps the entire dataset as a reference point. It then calculates the distance between the new data point and all the existing points using a distance metric (Eucilinedain distance e.g.). Based on these distances, it identifies the K nearest neighbors to these data points. We then count the occurrence of each class in the K nearest neighbors and assign the most frequently appearing class as the final prediction.
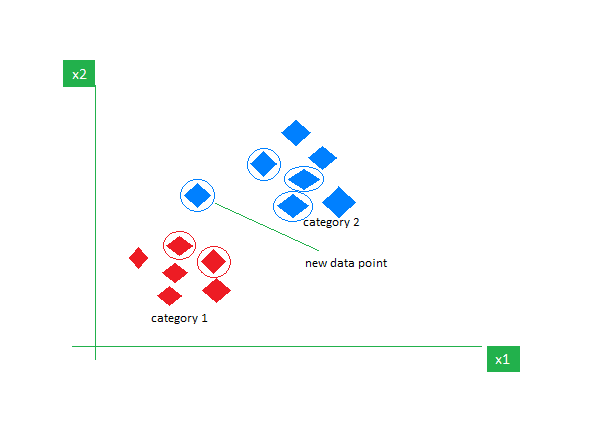
Image on GeeksforGeeks
Choosing the right value of K requires experimentation. Although it is robust to noisy data it is not suitable for high dimensional datasets and has a high cost associated due to the calculation of the distance from all data points.
Wrapping Up
As I conclude this article, I would encourage the readers to explore more algorithms and try to implement them from scratch. This will strengthen your understanding of how things are working under the hood. Here are some additional resources to help you get started:
- Mastering Machine Learning Algorithms - Second Edition
- Machine Learning Course - Javatpoint
- Machine Learning Specialization - Coursera
Kanwal Mehreen is an aspiring software developer with a keen interest in data science and applications of AI in medicine. Kanwal was selected as the Google Generation Scholar 2022 for the APAC region. Kanwal loves to share technical knowledge by writing articles on trending topics, and is passionate about improving the representation of women in tech industry.