 How to solve 90% of NLP problems: a step-by-step guide
 How to solve 90% of NLP problems: a step-by-step guide
Read this insightful, step-by-step article on how to use machine learning to understand and leverage text.
By Emmanuel Ameisen, Head of AI at Insight Data Science

How you can apply the 5 W’s and H to Text Data!
For more content like this, follow Insight and Emmanuel on Twitter.
Text data is everywhere
Whether you are an established company or working to launch a new service, you can always leverage text data to validate, improve, and expand the functionalities of your product. The science of extracting meaning and learning from text data is an active topic of research called Natural Language Processing (NLP).
NLP produces new and exciting results on a daily basis, and is a very large field. However, having worked with hundreds of companies, the Insight team has seen a few key practical applications come up much more frequently than any other:
- Identifying different cohorts of users/customers (e.g. predicting churn, lifetime value, product preferences)
- Accurately detecting and extracting different categories of feedback (positive and negative reviews/opinions, mentions of particular attributes such as clothing size/fit…)
- Classifying text according to intent (e.g. request for basic help, urgent problem)
While many NLP papers and tutorials exist online, we have found it hard to find guidelines and tips on how to approach these problems efficiently from the ground up.
How this article can help
After leading hundreds of projects a year and gaining advice from top teams all over the United States, we wrote this post to explain how to build Machine Learning solutions to solve problems like the ones mentioned above. We’ll begin with the simplest method that could work, and then move on to more nuanced solutions, such as feature engineering, word vectors, and deep learning.
After reading this article, you’ll know how to:
- Gather, prepare and inspect data
- Build simple models to start, and transition to deep learning if necessary
- Interpret and understand your models, to make sure you are actually capturing information and not noise
We wrote this post as a step-by-step guide; it can also serve as a high level overview of highly effective standard approaches.
This post is accompanied by an interactive notebook demonstrating and applying all these techniques. Feel free to run the code and follow along!
Step 1: Gather your data
Example data sources
Every Machine Learning problem starts with data, such as a list of emails, posts, or tweets. Common sources of textual information include:
- Product reviews (on Amazon, Yelp, and various App Stores)
- User-generated content (Tweets, Facebook posts, StackOverflow questions)
- Troubleshooting (customer requests, support tickets, chat logs)
“Disasters on Social Media” dataset
For this post, we will use a dataset generously provided by Figure Eight, called “Disasters on Social Media”, where:
Contributors looked at over 10,000 tweets culled with a variety of searches like “ablaze”, “quarantine”, and “pandemonium”, then noted whether the tweet referred to a disaster event (as opposed to a joke with the word or a movie review or something non-disastrous).
Our task will be to detect which tweets are about a disastrous event as opposed to an irrelevant topic such as a movie. Why? A potential application would be to exclusively notify law enforcement officials about urgent emergencies while ignoring reviews of the most recent Adam Sandler film. A particular challenge with this task is that both classes contain the same search terms used to find the tweets, so we will have to use subtler differences to distinguish between them.
In the rest of this post, we will refer to tweets that are about disasters as “disaster”, and tweets about anything else as “irrelevant”.
Labels
We have labeled data and so we know which tweets belong to which categories. As Richard Socher outlines below, it is usually faster, simpler, and cheaper to find and label enough data to train a model on, rather than trying to optimize a complex unsupervised method.
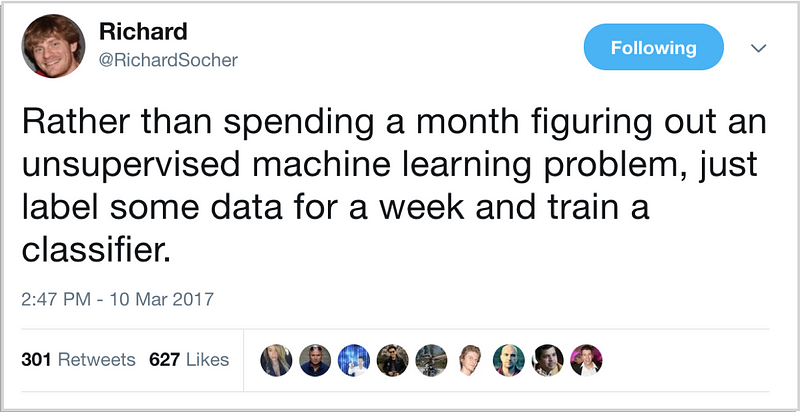
Richard Socher’s pro-tip
Step 2: Clean your data
The number one rule we follow is: “Your model will only ever be as good as your data.”
One of the key skills of a data scientist is knowing whether the next step should be working on the model or the data. A good rule of thumb is to look at the data first and then clean it up. A clean dataset will allow a model to learn meaningful features and not overfit on irrelevant noise.
Here is a checklist to use to clean your data: (see the code for more details):
- Remove all irrelevant characters such as any non alphanumeric characters
- Tokenize your text by separating it into individual words
- Remove words that are not relevant, such as “@” twitter mentions or urls
- Convert all characters to lowercase, in order to treat words such as “hello”, “Hello”, and “HELLO” the same
- Consider combining misspelled or alternately spelled words to a single representation (e.g. “cool”/”kewl”/”cooool”)
- Consider lemmatization (reduce words such as “am”, “are”, and “is” to a common form such as “be”)
After following these steps and checking for additional errors, we can start using the clean, labelled data to train models!
Step 3: Find a good data representation
Machine Learning models take numerical values as input. Models working on images, for example, take in a matrix representing the intensity of each pixel in each color channel.

A smiling face represented as a matrix of numbers.
Our dataset is a list of sentences, so in order for our algorithm to extract patterns from the data, we first need to find a way to represent it in a way that our algorithm can understand, i.e. as a list of numbers.
One-hot encoding (Bag of Words)
A natural way to represent text for computers is to encode each character individually as a number (ASCII for example). If we were to feed this simple representation into a classifier, it would have to learn the structure of words from scratch based only on our data, which is impossible for most datasets. We need to use a higher level approach.
For example, we can build a vocabulary of all the unique words in our dataset, and associate a unique index to each word in the vocabulary. Each sentence is then represented as a list that is as long as the number of distinct words in our vocabulary. At each index in this list, we mark how many times the given word appears in our sentence. This is called a Bag of Words model, since it is a representation that completely ignores the order of words in our sentence. This is illustrated below.
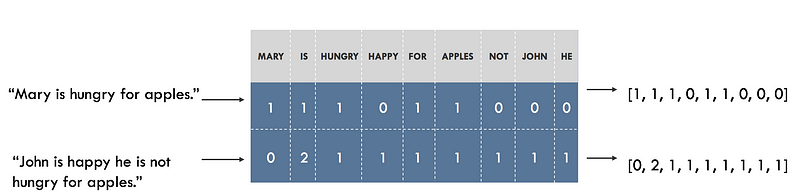
Representing sentences as a Bag of Words. Sentences on the left, representation on the right. Each index in the vectors represent one particular word.
Visualizing the embeddings
We have around 20,000 words in our vocabulary in the “Disasters of Social Media” example, which means that every sentence will be represented as a vector of length 20,000. The vector will contain mostly 0s because each sentence contains only a very small subset of our vocabulary.
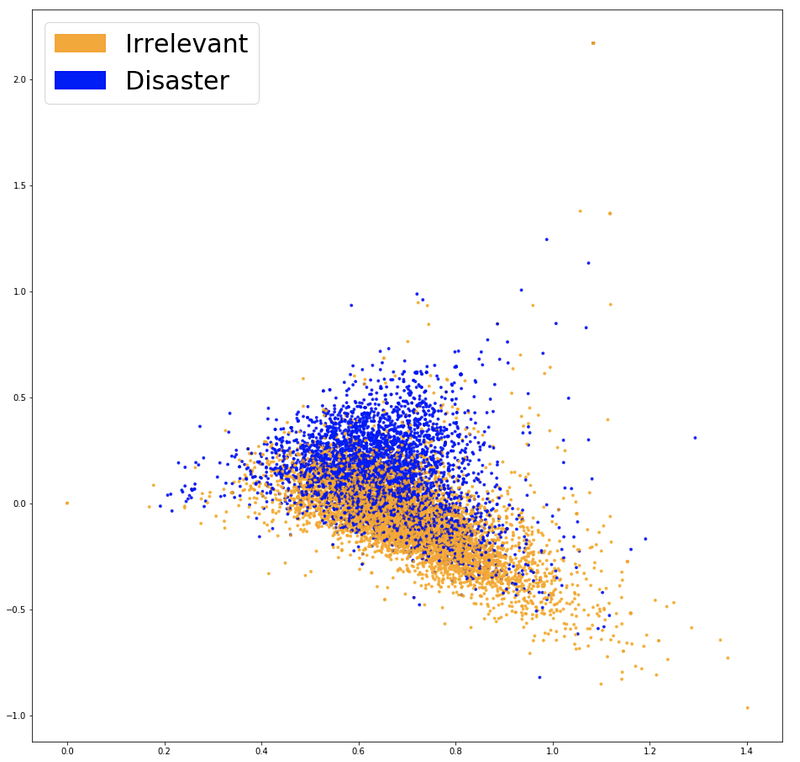
In order to see whether our embeddings are capturing information that is relevant to our problem (i.e. whether the tweets are about disasters or not), it is a good idea to visualize them and see if the classes look well separated. Since vocabularies are usually very large and visualizing data in 20,000 dimensions is impossible, techniques like PCA will help project the data down to two dimensions. This is plotted below.
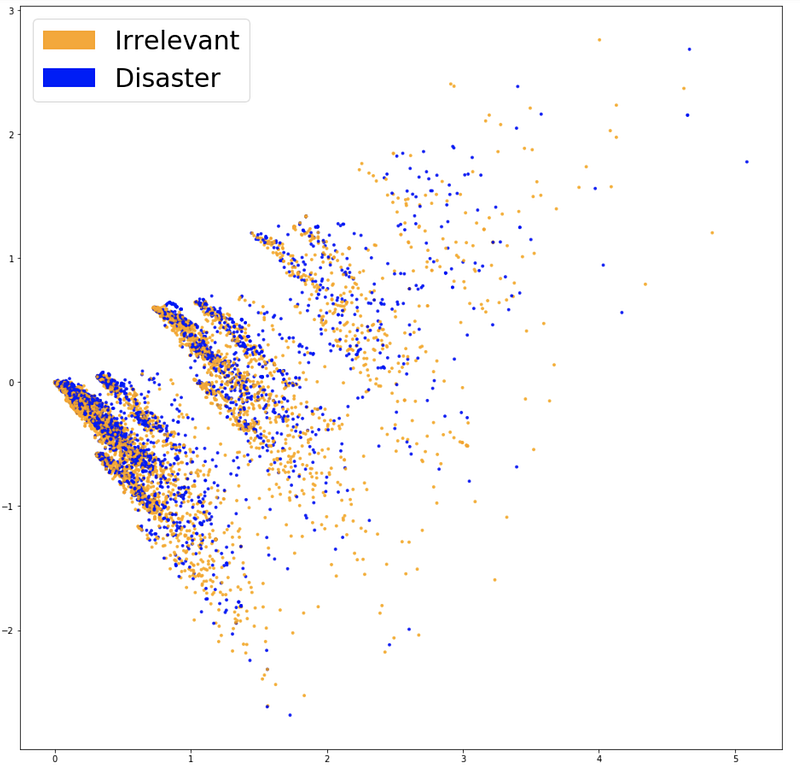
Visualizing Bag of Words embeddings.
The two classes do not look very well separated, which could be a feature of our embeddings or simply of our dimensionality reduction. In order to see whether the Bag of Words features are of any use, we can train a classifier based on them.
Step 4: Classification
When first approaching a problem, a general best practice is to start with the simplest tool that could solve the job. Whenever it comes to classifying data, a common favorite for its versatility and explainability is Logistic Regression. It is very simple to train and the results are interpretable as you can easily extract the most important coefficients from the model.
We split our data in to a training set used to fit our model and a test set to see how well it generalizes to unseen data. After training, we get an accuracy of 75.4%. Not too shabby! Guessing the most frequent class (“irrelevant”) would give us only 57%. However, even if 75% precision was good enough for our needs, we should never ship a model without trying to understand it.
Step 5: Inspection
Confusion Matrix
A first step is to understand the types of errors our model makes, and which kind of errors are least desirable. In our example, false positives are classifying an irrelevant tweet as a disaster, and false negatives are classifying a disaster as an irrelevant tweet. If the priority is to react to every potential event, we would want to lower our false negatives. If we are constrained in resources however, we might prioritize a lower false positive rate to reduce false alarms. A good way to visualize this information is using a Confusion Matrix, which compares the predictions our model makes with the true label. Ideally, the matrix would be a diagonal line from top left to bottom right (our predictions match the truth perfectly).
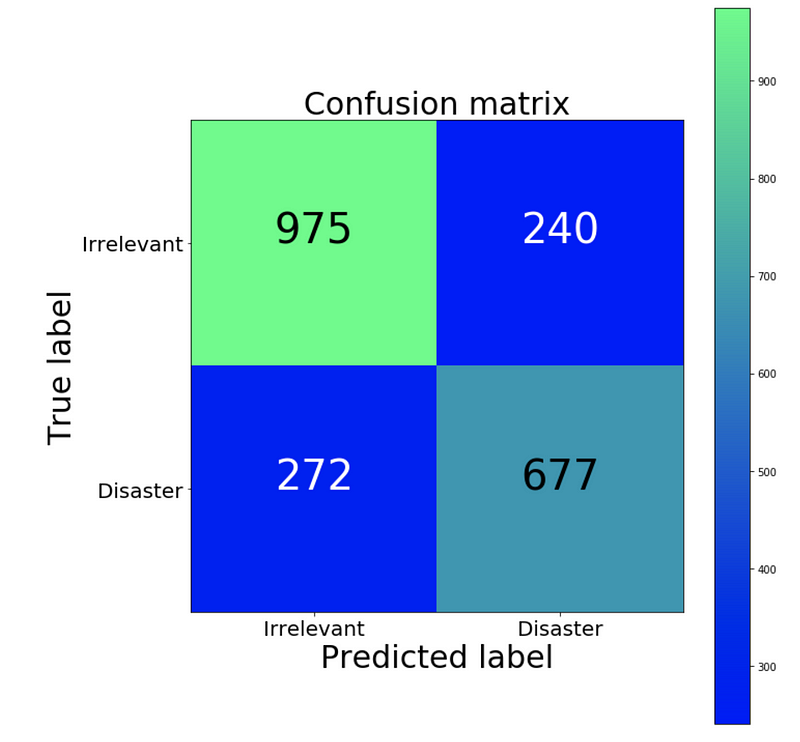
Confusion Matrix (Green is a high proportion, blue is low)
Our classifier creates more false negatives than false positives (proportionally). In other words, our model’s most common error is inaccurately classifying disasters as irrelevant. If false positives represent a high cost for law enforcement, this could be a good bias for our classifier to have.
Explaining and interpreting our model
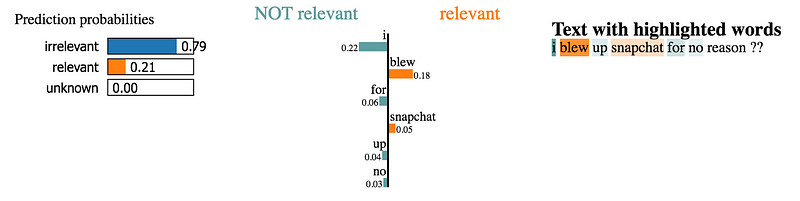
To validate our model and interpret its predictions, it is important to look at which words it is using to make decisions. If our data is biased, our classifier will make accurate predictions in the sample data, but the model would not generalize well in the real world. Here we plot the most important words for both the disaster and irrelevant class. Plotting word importance is simple with Bag of Words and Logistic Regression, since we can just extract and rank the coefficients that the model used for its predictions.
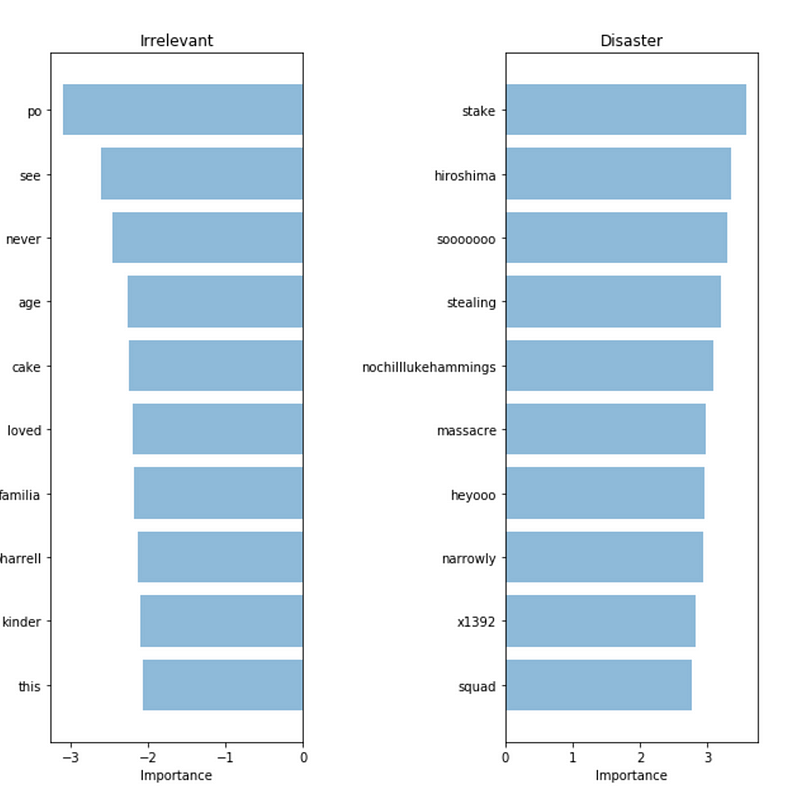
Bag of Words: Word importance
Our classifier correctly picks up on some patterns (hiroshima, massacre), but clearly seems to be overfitting on some meaningless terms (heyoo, x1392). Right now, our Bag of Words model is dealing with a huge vocabulary of different words and treating all words equally. However, some of these words are very frequent, and are only contributing noise to our predictions. Next, we will try a way to represent sentences that can account for the frequency of words, to see if we can pick up more signal from our data.
Step 6: Accounting for vocabulary structure
TF-IDF
In order to help our model focus more on meaningful words, we can use a TF-IDF score (Term Frequency, Inverse Document Frequency) on top of our Bag of Words model. TF-IDF weighs words by how rare they are in our dataset, discounting words that are too frequent and just add to the noise. Here is the PCA projection of our new embeddings.
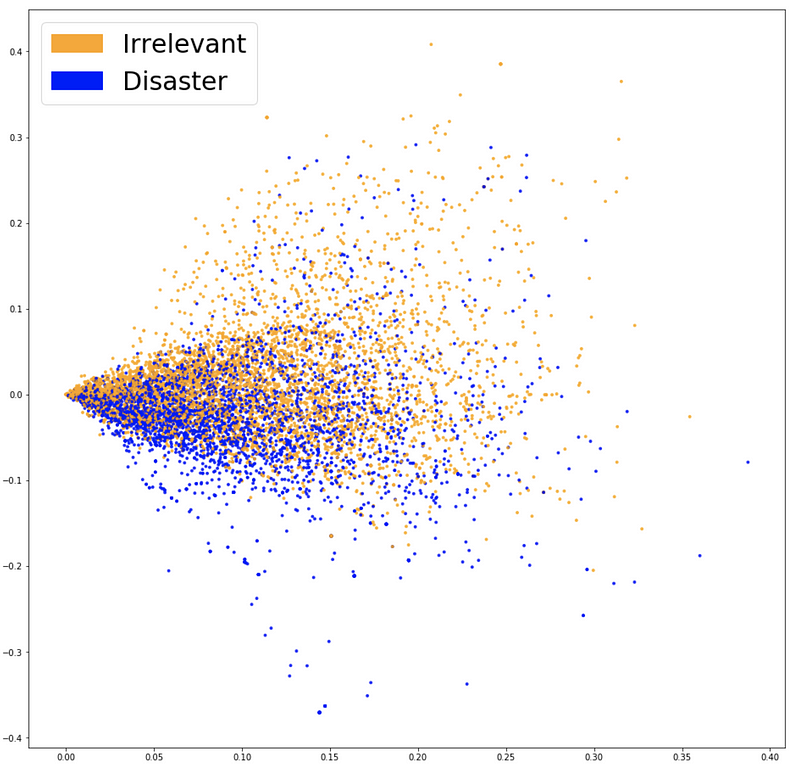
Visualizing TF-IDF embeddings.
We can see above that there is a clearer distinction between the two colors. This should make it easier for our classifier to separate both groups. Let’s see if this leads to better performance. Training another Logistic Regression on our new embeddings, we get an accuracy of 76.2%.
A very slight improvement. Has our model started picking up on more important words? If we are getting a better result while preventing our model from “cheating” then we can truly consider this model an upgrade.
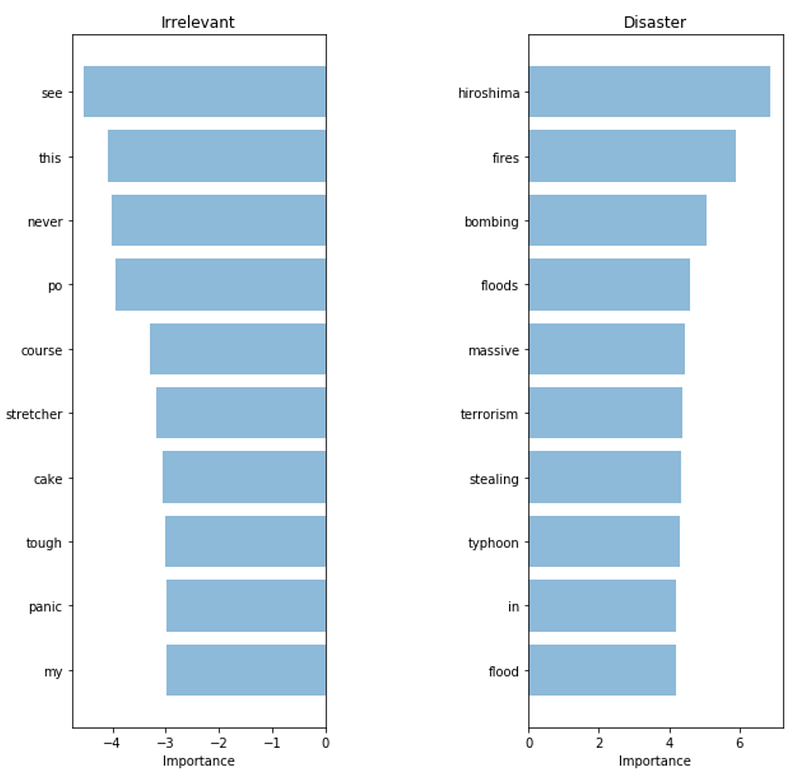
TF-IDF: Word importance
The words it picked up look much more relevant! Although our metrics on our test set only increased slightly, we have much more confidence in the terms our model is using, and thus would feel more comfortable deploying it in a system that would interact with customers.
Step 7: Leveraging semantics
Word2Vec
Our latest model managed to pick up on high signal words. However, it is very likely that if we deploy this model, we will encounter words that we have not seen in our training set before. The previous model will not be able to accurately classify these tweets, even if it has seen very similar words during training.
To solve this problem, we need to capture the semantic meaning of words, meaning we need to understand that words like ‘good’ and ‘positive’ are closer than ‘apricot’ and ‘continent.’ The tool we will use to help us capture meaning is called Word2Vec.
Using pre-trained words
Word2Vec is a technique to find continuous embeddings for words. It learns from reading massive amounts of text and memorizing which words tend to appear in similar contexts. After being trained on enough data, it generates a 300-dimension vector for each word in a vocabulary, with words of similar meaning being closer to each other.
The authors of the paper open sourced a model that was pre-trained on a very large corpus which we can leverage to include some knowledge of semantic meaning into our model. The pre-trained vectors can be found in the repository associated with this post.
Sentence level representation
A quick way to get a sentence embedding for our classifier is to average Word2Vec scores of all words in our sentence. This is a Bag of Words approach just like before, but this time we only lose the syntax of our sentence, while keeping some semantic information.
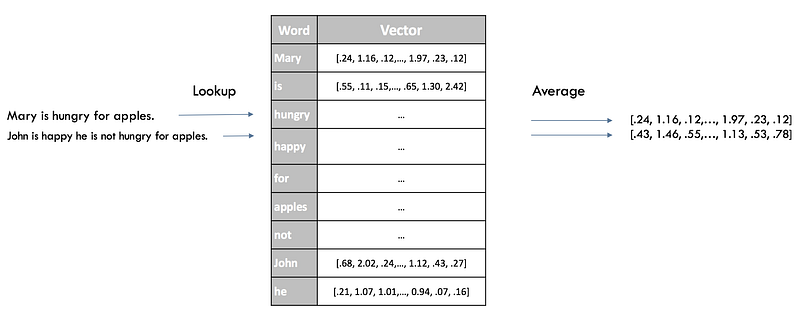
Word2Vec sentence embedding
Here is a visualization of our new embeddings using previous techniques:
Visualizing Word2Vec embeddings.
The two groups of colors look even more separated here, our new embeddings should help our classifier find the separation between both classes. After training the same model a third time (a Logistic Regression), we get an accuracy score of 77.7%, our best result yet! Time to inspect our model.
The Complexity/Explainability trade-off
Since our embeddings are not represented as a vector with one dimension per word as in our previous models, it’s harder to see which words are the most relevant to our classification. While we still have access to the coefficients of our Logistic Regression, they relate to the 300 dimensions of our embeddings rather than the indices of words.
For such a low gain in accuracy, losing all explainability seems like a harsh trade-off. However, with more complex models we can leverage black box explainers such as LIME in order to get some insight into how our classifier works.
LIME
LIME is available on Github through an open-sourced package. A black-box explainer allows users to explain the decisions of any classifier on one particular example by perturbing the input (in our case removing words from the sentence) and seeing how the prediction changes.
Let’s see a couple explanations for sentences from our dataset.
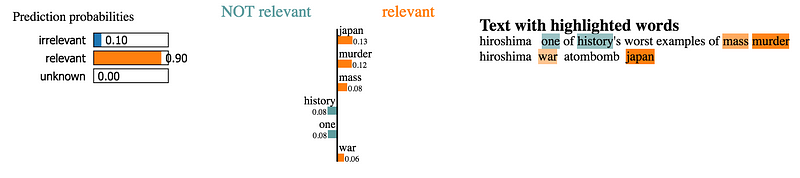
Correct disaster words are picked up to classify as “relevant”.
Here, the contribution of the words to the classification seems less obvious.
However, we do not have time to explore the thousands of examples in our dataset. What we’ll do instead is run LIME on a representative sample of test cases and see which words keep coming up as strong contributors. Using this approach we can get word importance scores like we had for previous models and validate our model’s predictions.
Word2Vec: Word importance
Looks like the model picks up highly relevant words implying that it appears to make understandable decisions. These seem like the most relevant words out of all previous models and therefore we’re more comfortable deploying in to production.
Step 8: Leveraging syntax using end-to-end approaches
We’ve covered quick and efficient approaches to generate compact sentence embeddings. However, by omitting the order of words, we are discarding all of the syntactic information of our sentences. If these methods do not provide sufficient results, you can utilize more complex model that take in whole sentences as input and predict labels without the need to build an intermediate representation. A common way to do that is to treat a sentence as a sequence of individual word vectors using either Word2Vec or more recent approaches such as GloVe or CoVe. This is what we will do below.
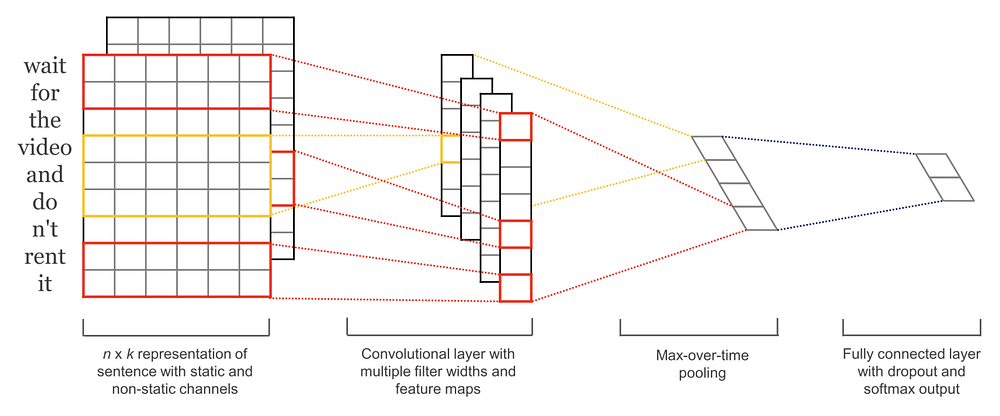
A highly effective end-to-end architecture (source)
Convolutional Neural Networks for Sentence Classification train very quickly and work well as an entry level deep learning architecture. While Convolutional Neural Networks (CNN) are mainly known for their performance on image data, they have been providing excellent results on text related tasks, and are usually much quicker to train than most complex NLP approaches (e.g. LSTMs and Encoder/Decoder architectures). This model preserves the order of words and learns valuable information on which sequences of words are predictive of our target classes. Contrary to previous models, it can tell the difference between “Alex eats plants” and “Plants eat Alex.”
Training this model does not require much more work than previous approaches (see code for details) and gives us a model that is much better than the previous ones, getting 79.5% accuracy! As with the models above, the next step should be to explore and explain the predictions using the methods we described to validate that it is indeed the best model to deploy to users. By now, you should feel comfortable tackling this on your own.
Final Notes
Here is a quick recap of the approach we’ve successfully used:
- Start with a quick and simple model
- Explain its predictions
- Understand the kind of mistakes it is making
- Use that knowledge to inform your next step, whether that is working on your data, or a more complex model.
These approaches were applied to a particular example case using models tailored towards understanding and leveraging short text such as tweets, but the ideas are widely applicable to a variety of problems. I hope this helped you, we’d love to hear your comments and questions! Feel free to comment below or reach out to @EmmanuelAmeisen here or on Twitter.
Want to learn applied Artificial Intelligence from top professionals in Silicon Valley or New York? Learn more about the Artificial Intelligence program.
Are you a company working in AI and would like to get involved in the Insight AI Fellows Program? Feel free to get in touch.
Bio: Emmanuel Ameisen (@EmmanuelAmeisen) is Head of AI at Insight Data Science.
Original. Reposted with permission.
Related:
- Top 10 Books on NLP and Text Analysis
- NLP Overview: Modern Deep Learning Techniques Applied to Natural Language Processing
- Approaches to Text Summarization: An Overview