How do you check the quality of your regression model in Python?
Linear regression is rooted strongly in the field of statistical learning and therefore the model must be checked for the ‘goodness of fit’. This article shows you the essential steps of this task in a Python ecosystem.

Why it is important (and why you might be missing it)
For all the talk and hair-splitting on the intricacies of the latest deep neural net architectures and the amazing power of xgboost on the Kaggle competitions, for a large portion of the industry, using data-driven analytics and machine learning (ML) techniques, regression remains the top choice for their daily use.
See this KDnuggets poll result from 2018–19 (by Matthew Mayo).
The technique of regression comes in many forms — linear, nonlinear, poison, tree-based- but the core idea remains almost same across the board and can be applied to a wide variety of predictive analytics problems in finance, healthcare, service industry, manufacturing, agriculture, etc.
Linear regression is the fundamental technique, which is rooted strongly in the time-tested theory of statistical learning and inference, and powers all the regression-based algorithms used in modern data science pipeline.
However, the success of a linear regression model also depends on some fundamental assumptions about the nature of the underlying data that it tries to model. See this article for a simple and intuitive understanding of these assumptions,
It is, therefore, extremely important to check the quality of your linear regression model, by verifying whether these assumptions were “reasonably” satisfied (generally visual analytics methods, which are subject to interpretation, are used to check the assumptions).
The problem is that checking the quality of the model is often a less prioritized aspect of a data science task flow where other priorities dominate — prediction, scaling, deployment, and model tuning.
Does this assertion sound too bold? There is an easy test.
In an industry standard Python-based data science stack, how many times have you used Pandas, NumPy, Scikit-learn, or even PostgreSQL for data acquisition, wrangling, visualization, and finally constructing and tuning your ML model? Plenty of times, I suppose?
Now, how many times have you used the statsmodels library to examine the model by running goodness-of-fit tests?
It is very common in a Python-based data science learning track, to go like this,

The answer to the question “Is something missing” is yes!

Often, there is plenty of discussion about regularization, bias-variance trade-off, or scalability (learning and complexity curves) plots. But, is there sufficient discussion around the following plots and lists?
- Residuals vs. predicting variables plots
- Fitted vs. residuals plot
- Histogram of the normalized residuals
- Q-Q plot of the normalized residuals
- Shapiro-Wilk normality test on the residuals
- Cook’s distance plot of the residuals
- Variance inflation factor (VIF) of the predicting features
It is clear that you have to wear the hat of a statistician, not only a data mining professional, for this part of the machine learning pipeline.

The issue with Scikit-learn
It can be safely assumed that the majority of statisticians-turned-data scientistsrun the goodness-of-fit tests regularly on their regression models.
But many young data scientists and analysts depend heavily, for data-driven modeling, on ML-focused packages like Scikit-learn, which, although being an awesome library and virtually a silver bullet for machine learning and prediction tasks, do not support easy and fast evaluation of model quality based on standard statistical tests.
Therefore, it is imperative that good data science pipeline, in addition to using an ML-focused library like Scikit-learn, include some standardized set of code to evaluate the quality of the model using statistical tests.
In this article, we show such a standard set of evaluations for a multivariate linear regression problem. We will use the statsmodels library for regression modeling and statistical tests.

A brief overview of linear regression assumptions and the key visual tests
The assumptions
The four key assumptions that need to be tested for a linear regression model are,
- Linearity: The expected value of the dependent variable is a linear function of each independent variable, holding the others fixed (note this does not restrict you to use a nonlinear transformation of the independent variables i.e. you can still model f(x) = ax² + bx + c, using both x² and x as predicting variables.
- Independence: The errors (residuals of the fitted model) are independent of each other.
- Homoscedasticity (constant variance): The variance of the errors is constant with respect to the predicting variables or the response.
- Normality: The errors are generated from a Normal distribution (of unknown mean and variance, which can be estimated from the data). Note, this is not a necessary condition to perform linear regression unlike the top three above. However, without this assumption being satisfied, you cannot calculate the so-called ‘confidence’ or ‘prediction’ intervals easily as the well-known analytical expressions corresponding to Gaussian distribution cannot be used.
For multiple linear regression, judging multicollinearity is also critical from the statistical inference point of view. This assumption assumes minimal or no linear dependence between the predicting variables.
Outliers can also be an issue impacting the model quality by having a disproportionate influence on the estimated model parameters.
Here is a visual recap,

What plots are can be checked?
So, error terms are pretty important.
But there is a piece of bad news. We can never know the true errors, no matter how much data we have. We can only estimate and draw inference about the distribution from which the data is generated.
Therefore, the proxy of true errors are the residuals, which are just the difference between the observed values and the fitted values.
Bottom line — we need to plot the residuals, check their random nature, variance, and distribution for evaluating the model quality. This is the visual analytics needed for goodness-of-fit estimation of a linear model.
Apart from this, multicollinearity can be checked from the correlation matrix and heatmap, and outliers in the data (residual) can be checked by so-called Cook’s distance plots.
Example of regression model quality evaluation
The entire code repo for this example can be found in the author’s Github.
We are using the concrete compressive strength prediction problem from the UCI ML portal. The concrete compressive strength is a highly complex function of age and ingredients. Can we predict the strength from measurement values of these parameters?
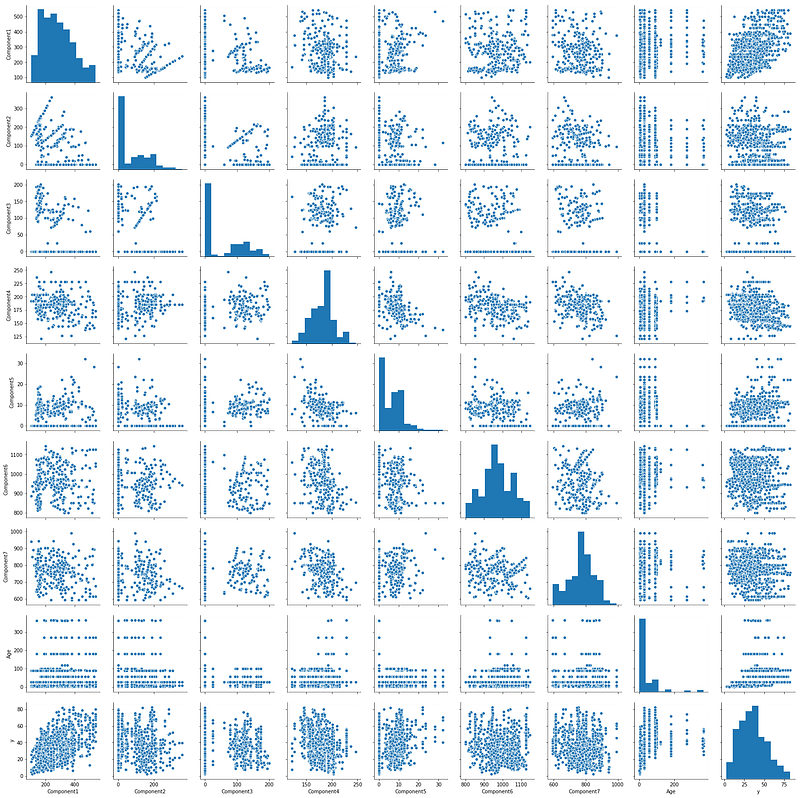
Scatterplot of variables to check for linearity
We can simply check the scatterplot for visual inspection of the assumption of linearity.

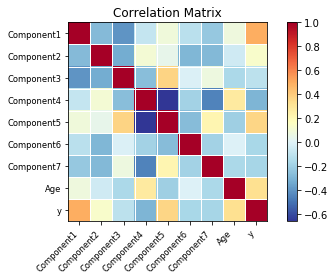
Pairwise scatter plots and correlation heatmap for checking multicollinearity
We can use the pairplot function from the seaborn library to plot the pairwise scatterplots of all combinations.
Furthermore, if the data is loaded in Pandas, we can easily compute the correlation matrix and pass that onto the special plotting function of statsmodelsto visualize the correlation as a heatmap.
Model fitting using statsmodel.ols() function
The main model fitting is done using the statsmodels.OLS method. It is an amazing linear model fit utility which feels very much like the powerful ‘lm’ function in R. Best of all, it accepts R-style formula for constructing the full or partial model (i.e. involving all or some of the predicting variables).
You may question, in the age of big data, why bother about creating a partial model and not throw all the data in? That is because confounding or hidden bias may be present in the data which can be addressed only by controlling for certain factors.
In any case, the summary of the model fitted through this model already provides rich statistical information about the model such as t-statistics and p-values corresponding to all the predicting variables, R-squared, and adjusted R-squared, AIC and BIC, etc.

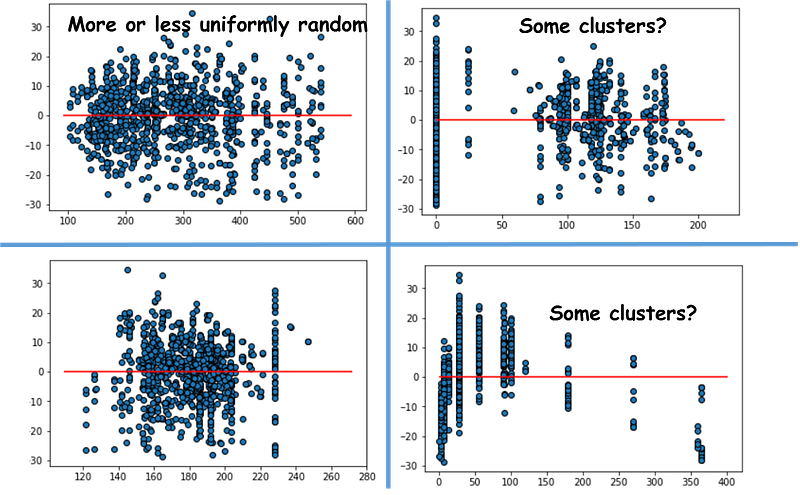
Residuals vs. predicting variables plots
Next, we can plot the residuals versus each of the predicting variables to look for independence assumption. If the residuals are distributed uniformly randomly around the zero x-axes and do not form specific clusters, then the assumption holds true. In this particular problem, we observe some clusters.
Fitted vs. residuals plot to check homoscedasticity
When we plot the fitted response values (as per the model) vs. the residuals, we clearly observe that the variance of the residuals increases with response variable magnitude. Therefore, the problem does not respect homoscedasticity and some kind of variable transformation may be needed to improve model quality.

Histogram and Q-Q plot of normalized residuals
To check the assumption of normality of the data generating process, we can simply plot the histogram and the Q-Q plot of the normalized residuals.

Additionally, we can run the Shapiro-Wilk test on the residuals to check for the Normality.
Outlier detection using Cook’s distance plot
Cook’s distance essentially measures the effect of deleting a given observation. Points with a large Cook’s distance need to be closely examined for being potential outliers. We can plot the Cook’s distance using a special outlier influence class from statsmodels.

Variance influence factors
The OLS model summary for this dataset shows a warning for multicollinearity. But how to check which factors are causing it?
We can compute the variance influence factors for each predicting variable. It is the ratio of variance in a model with multiple terms, divided by the variance of a model with one term alone. Again, we take advantage of the special outlier influence class in statsmodels.

Other residuals diagnostics
Statsmodels have a wide variety of other diagnostics tests for checking model quality. You can take a look at these pages.
Summary and thoughts
In this article, we covered how one can add essential visual analytics for model quality evaluation in linear regression — various residual plots, normality tests, and checks for multicollinearity.
One can even think of creating a simple suite of functions capable of accepting a scikit-learn type estimator and generating these plots for the data scientist to quickly check the model quality.
Currently, although scikit-learn does not have detailed statistical tests or plotting capabilities for the model quality evaluation, Yellowbrick is a promising Python library which can add intuitive visualization capability on scikit-learn objects. We can hope that in the near future, statistical tests can be added to scikit-learn ML estimators directly.
Ifyou have any questions or ideas to share, please contact the author at tirthajyoti[AT]gmail.com. Also, you can check the author’s GitHubrepositories for other fun code snippets in Python, R, or MATLAB and machine learning resources. If you are, like me, passionate about machine learning/data science, please feel free to add me on LinkedIn or follow me on Twitter.
Tirthajyoti Sarkar - Sr. Principal Engineer - Semiconductor, AI, Machine Learning - ON…
Georgia Institute of Technology Master of Science - MS, Analytics This MS program imparts theoretical and practical…www.linkedin.com
Bio: Tirthajyoti Sarkar is the Senior Principal Engineer at ON Semiconductor working on Deep Learning/Machine Learning based design automation projects.
Original. Reposted with permission.
Related: