 Top Data Science and Machine Learning Methods Used in 2018, 2019
 Top Data Science and Machine Learning Methods Used in 2018, 2019
Once again, the most used methods are Regression, Clustering, Visualization, Decision Trees/Rules, and Random Forests. The greatest relative increases this year are overwhelmingly Deep Learning techniques, while SVD, SVMs and Association Rules show the greatest decline.
In the latest KDnuggets poll, readers were asked:
Which Data Science / Machine Learning methods and algorithms did you use in 2018/2019 for a real-world application?
The results, based on 833 voters, show that the top 17 methods are the same as in the 2017 poll, although in slightly different order:
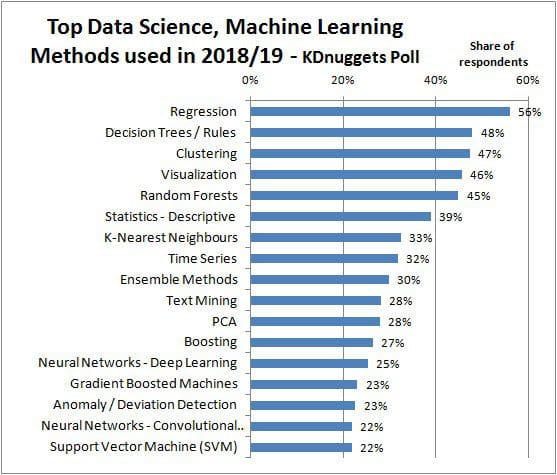
The top 17 methods by respondent usage this year (spot #16 was a tie, by percentage) are:
- Regression
- Decision Trees / Rules
- Clustering
- Visualization
- Random Forests
- Statistics - Descriptive
- K-Nearest Neighbours
- Time Series
- Ensemble Methods
- Text Mining
- PCA
- Boosting
- Neural Networks - Deep Learning
- Gradient Boosted Machines
- Anomaly / Deviation Detection
- Neural Networks - Convolutional Neural Networks (CNNs)
- Support Vector Machine (SVM)
This, in turn, mirrors the results of the 2017 poll, which found that the top 10 methods remained unchanged from the 2016 poll (although, again, they were in a different order).
The average respondent used 7.4 methods/algorithms, which is in-line with both the 2017 and 2016 results.
Below is a comparison of the top methods and algorithms in this year's poll with their 2017 shares.
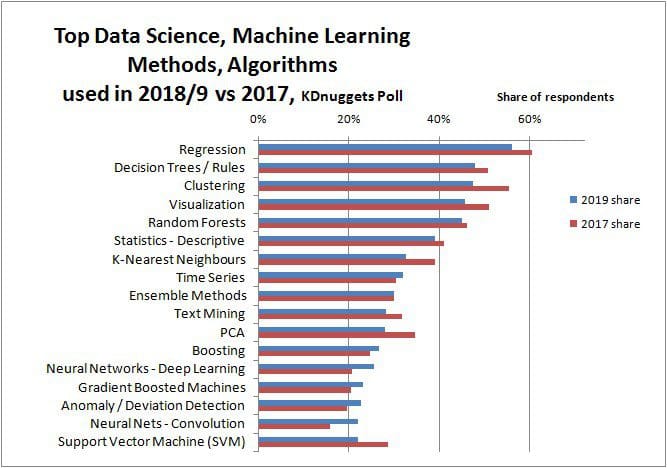
The most notable increases this year were found in the usage of various neural network technologies, including GANs, RNNs, CNNs, reinforcement learning, and vanilla deep neural networks. Genetic and evolutionary algorithms have also found an increase, along with the catch-all "Other Methods."
The methods and algorithms with the greatest relative increases measured by (share2019 / share2017 - 1) over 2017 are:
- Generative Adversarial Networks (GAN), 101.8% up, from 2.3% share in 2017 to 4.7% share in 2018/9
- Neural Networks - Recurrent Neural Networks (RNN), 56.5% up, from 10.5% to 16.5%
- Reinforcement Learning, 56.1% up, from 4.2% to 6.6%
- Neural Nets - Convolution, 38.8% up, from 15.8% to 22%
- Other Methods, 27.1% up, from 6.1% to 7.8%
- Genetic / Evolutionary Algorithms & Methods, 25.7% up, from 4.8% to 6.0%
- Neural Networks - Deep Learning, 23.5% up, from 20.6% to 25%
The greatest declines this year were:
- SVD, 25.4% down, from 8.1% share in 2017 to 6.0% share in 2018/9
- Support Vector Machine (SVM), 23.3% down, from 28.7% to 22%
- Factor Analysis, 21.2% down, from 11.7% to 9.3%
- Association Rules, 20.6% down, from 15.4% to 12.3%
- PCA, 19.3% down, from 34.7% to 28%
- Survival Analysis, 19.1% down, from 8.5% to 6.9%
Affiliation
Participation by affiliation was:
- Industry / Self employed, 64.9% (541 responses), 7.8 avg. tools used
- Student, 15.8% (132 responses), 6.1 avg. tools used
- Academia, 9.2% (77 responses), 7.9 avg. tools used
- Government / Non-profit, 7.3% (61 responses), 5.8 avg. tools used
Note that only 22 respondents (<3%) selected "Other", 7.5 avg. tools used.
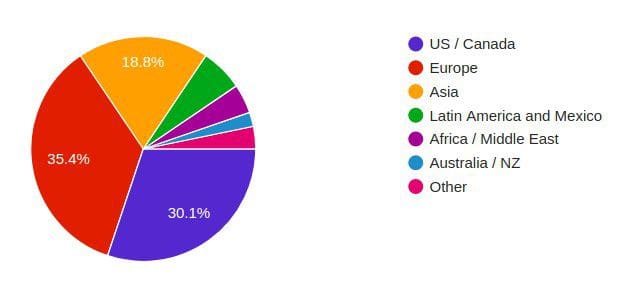
Regional Participation
Finally, regional participation was:
Europe, 35.4%
US/Canada, 30.1%
Asia, 18.8%
Latin America, 6.1%
Australia/NZ, 2%
Africa/Middle East, 4.2%
Other, 3.2%
Thanks to everyone who participated in the poll, and for making this compilation and analysis of trends possible.
Here are the results of past polls:
- Where Analytics, Data Science, Machine Learning Were Applied: Trends and Analysis (2017)
- Where Analytics, Data Mining, Data Science were applied in 2016
- Where Analytics, Data Mining, Data Science were applied in 2015
- Where Analytics, Data Mining, Data Science was applied in 2014?
- Where did you apply Analytics/Data Mining in 2012?
- Industries / Fields where you applied Analytics / Data Mining, 2011.
- Industries / Fields for Analytics / Data Mining, 2010.
- Data Mining Applications, 2009.
- Data Mining Applications, 2008.
- Data Mining Applications by Industry, 2007.
- Industries/fields where you applied data mining, 2006.