P-values Explained By Data Scientist
This article is designed to give you a full picture from constructing a hypothesis testing to understanding p-value and using that to guide our decision making process.
By Admond Lee, Micron Technology / AI Time Journal / Tech in Asia
I remember when I was having my first overseas internship at CERN as a summer student, most people were still talking about the discovery of Higgs boson upon confirming that it met the “five sigma” threshold (which means having p-value of 0.0000003).
Back then I knew nothing about p-value, hypothesis testing or even statistical significance.
And you’re right.
I went to google the word — p-value, and what I found on Wikipedia made me even more confused…
In statistical hypothesis testing, the p-value or probability value is, for a given statistical model, the probability that, when the null hypothesis is true, the statistical summary (such as the absolute value of the sample mean difference between two compared groups) would be greater than or equal to the actual observed results.
— Wikipedia
Well done Wikipedia.
Okay. I ended up not really understanding what p-value really meant.
Until now, after going into data science field, I finally begin to appreciate the meaning of p-value and how it could be used as part of the decision making tools in certain experiments.
Therefore, I decided to explain p-values in this article and how they could be used in hypothesis testings to hopefully give you a better and intuitive understanding of p-values.
While we can’t skip the fundamental understanding of other concepts and the definition of p-value, I promise I’ll make this explanation in an intuitive way without bombarding you with all the technical terms that I faced.
There are total four sections in this article to give you a full picture from constructing a hypothesis testing to understanding p-value and using that to guide our decision making process. I strongly encourage you to go through all of them to give you a detailed understanding of p-values:
- Hypothesis Testing
- Normal Distribution
- What is P-value?
- Statistical Significance
It’ll be fun. ????
Let’s get started!
1. Hypothesis Testing
Before we talk about what p-value means, let’s begin by understanding hypothesis testing where p-value is used to determine the statistical significance of our results.
Our ultimate goal is to determine the statistical significance of our results.
And statistical significance is built on these 3 simple ideas:
- Hypothesis testing
- Normal distribution
- P-values
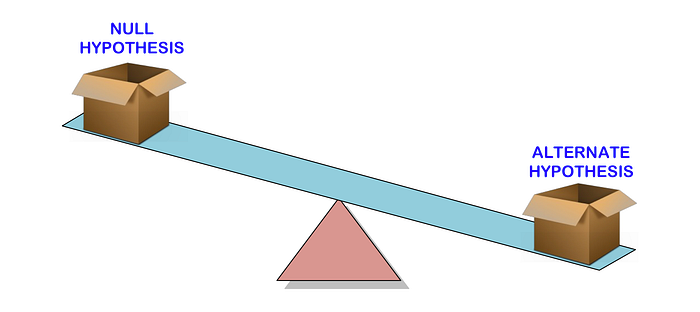
Hypothesis testing is used to test the validity of a claim (null hypothesis)that is made about a population using sample data. The alternative hypothesis is the one you would believe if the null hypothesis is concluded to be untrue.
In other words, we’ll make a claim (null hypothesis) and use a sample data to check if the claim is valid. If the claim isn’t valid, then we’ll choose our alternative hypothesis instead. Simple as that.
To know if a claim is valid or not, we’ll use a p-value to weigh the strength of the evidence to see if it’s statistically significant. If the evidence supports the alternative hypothesis, then we’ll reject the null hypothesis and accept the alternative hypothesis. This will be explained further in the later section.
Let’s use an example to make this concept clearer and this example will be used throughout this article for other concepts.
???? ???? Example: Suppose a pizza place claims their delivery times are 30 minutes or less on average but you think it’s more than that. So you conduct a hypothesis test and randomly sample some delivery times to test the claim:
- Null hypothesis — The mean delivery time is 30 minutes or less
- Alternative hypothesis — The mean delivery time is greater than 30 minutes
The goal here is to determine which claim — the null or alternative — is better supported by the evidence found from our sample data.
We’ll use one-tailed test in our case since we only care about if the mean delivery time is greater than 30 minutes. We’ll disregard the possibility in the other direction since the consequences of having a mean delivery time lower or equal to 30 minutes are even more preferable. What we want to test here is to see if there is a chance that the mean delivery time is greater than 30 minutes. In other words, we want to see if the pizza place lied to us somehow.????
One of the common ways to do the hypothesis testing is to use Z-test. Here we won’t go into details as we want to have a high level understanding of what’s going on on the surface before we dive deeper.
2. Normal Distribution
Normal distribution is a probability density function used to see the data distribution.
The normal distribution has two parameters — the mean (μ) and standard deviation, also called sigma (σ).
The mean is the central tendency of the distribution. It defines the location of the peak for normal distributions. The standard deviation is a measure of variability. It determines how far away from the mean the values tend to fall.
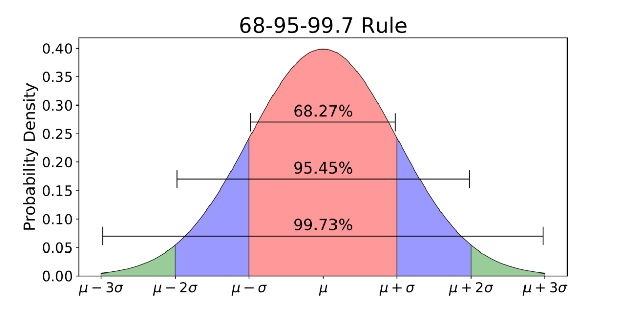
The normal distribution is commonly associated with the 68-95-99.7 rule(image above).
- 68% of the data is within 1 standard deviation (σ) of the mean (μ)
- 95% of the data is within 2 standard deviations (σ) of the mean (μ)
- 99.7% of the data is within 3 standard deviations (σ) of the mean (μ)
Remember the “five sigma” threshold for the discovery of Higgs boson that I talked about in the beginning? 5 sigma is about 99.9999426696856% of the data to hit before scientists confirmed the discovery of Higgs boson. That was the stringent threshold set to avoid any potential false signals.
Cool. Now you may be wondering, “How does the normal distribution apply to our previous hypothesis testing?”
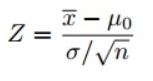
Since we used Z-test to conduct our hypothesis testing, we need to calculate Z-scores (to be used in our test-statistic) which is the number of standard deviations from the mean a data point is. In our case, each data point is the pizza delivery time that we collected.
Notice that when we’ve calculated all the Z-scores for each pizza delivery time and plotted a standard normal distribution curve as below, the unit on the X-axis will change from minutes to standard deviation unit since we’ve standardized the variable by subtracting the mean and dividing by its standard deviation (see the formula above).
Looking at the standard normal distribution curve is useful because we can compare results from a test to a “normal” population with a standardized unit in standard deviation, especially when we have a variable that comes with different units.
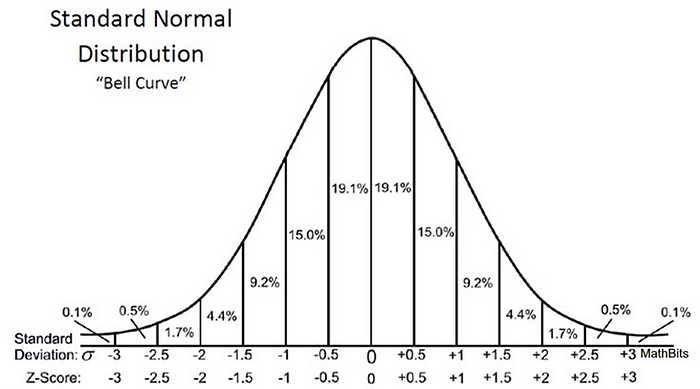
A Z-score can tell us where the overall data lies compared to the average population.
I like how Will Koehrsen put it this way — The higher or lower the Z-score, the more unlikely the result is to happen by chance and the more likely the result is meaningful.
But how high (or low) is considered as sufficiently convincing to quantify how meaningful our results are?
????????Punchline
This is where we need the last piece of item to solve the puzzle — p-value, and check if our results are statistically significant based on the significance level (also known as alpha) we set before we began our experiment.
3. What is P-value?
p-value beautifully explained by Cassie Kozyrkov
Finally… Here we are talking about p-value!
All the previous explanation is meant to set the stage and lead us to this p-value. We need the previous context and steps for us to make sense of this mysterious (actually not so mysterious) p-value and how it could lead to our decisions for the hypothesis testing.
If you’ve made it this far, keep reading. Because this section is the most exciting part of all!
Instead of explaining p-values using the definition given by Wikipedia(sorry Wikipedia), let’s explain that in our context — pizza delivery time!
Recall that we randomly sampled some pizza delivery times and the goal is to check if the mean delivery time is greater than 30 minutes. If the final evidence supports the claim by the pizza place (mean delivery time is 30 minutes or less), then we will not reject the null hypothesis. Otherwise, we’ll reject the null hypothesis.
The job of p-value therefore here is to answer this question:
If I’m living in a world where the pizza delivery time is 30 minutes or less (null hypothesis is true), how surprising is my evidence in real life?
P-value answers this question with a number — probability.
The lower the p-value, the more surprising the evidence is, the more ridiculous our null hypothesis looks.
And what do we do when we feel ridiculous with our null hypothesis? We reject that and choose our alternative hypothesis instead.
If the p-value is lower than a predetermined significance level (people call it alpha, I call it the threshold of being ridiculous — don’t ask my why, I just find it easier for me to understand), then we reject the null hypothesis.
Now we understand what p-value means. Let’s apply that in our case.
???? P-value in pizza delivery times ????
Now that we’ve collected some sampled delivery times, we perform the calculation and find that the mean delivery time is longer by 10 minutes with a p-value of 0.03.
What this means is that in a world where the pizza delivery time is 30 minutes or less (null hypothesis is true), there’s a 3% chance we would see the mean delivery time is at least 10 minutes longer due to random noise.
The lower the p-value, the more meaningful the result because it is less likely to be caused by noise.
There’s a common misinterpretation of p-value for most people in our case:
The p-value 0.03 means that there’s 3% (probability in percentage) that the result is due to chance — which is not true.
People often want to have a definite answer (including me), and this is how I got myself confused for a long time to interpret p-values.
A p-value doesn’t *prove* anything. It’s simply a way to use surprise as a basis for making a reasonable decision.
— Cassie Kozyrkov
Here’s how we can use the p-value of 0.03 to help us to make a reasonable decision (IMPORTANT):
- Imagine we live in a world where the mean delivery time is always 30 minutes or less — because we believe in the pizza place (our initial belief)!
- After analyzing the sample delivery times collected, the p-value of 0.03 is lower than the significance level of 0.05 (assume that we set this before our experiment), and we can say that the result is statistically significant.
- Because we’ve always been believing the pizza place that it can fulfil its promise to deliver pizza in 30 minutes or less, we now need to think if this belief still makes sense since the result tells us that the pizza place fails to deliver its promise and the result is statistically significant.
- So what do we do? At first, we try to think of every possible way to make our initial belief (null hypothesis) valid. But because the pizza place is slowly getting bad reviews from others and it often gave bad excuses that caused the late delivery, even we ourselves feel ridiculous to justify for the pizza place anymore and hence, we decide to reject the null hypothesis.
- Finally, the subsequent reasonable decision is to choose not to buy any pizza from that place again.
By now you may have already realized something… Depending on our context, p-values are not used to prove or justify anything.
In my opinion, p-values are used as a tool to challenge our initial belief (null hypothesis) when the result is statistically significant. The moment we feel ridiculous with our own belief (provided the p-value shows the result is statistically significant), we discard our initial belief (reject the null hypothesis) and make a reasonable decision.
4. Statistical Significance
Finally, this is the final stage where we put everything together and test if the result is statistically significant.
Having just the p-value is not enough, we need to set a threshold (aka significance level — alpha). The alpha should always be set before an experiment to avoid bias. If the observed p-value is lower than alpha, then we conclude that the result is statistically significant.
The rule of thumb is to set alpha to be either 0.05 or 0.01 (again, the value depends on your problems at hand).
As mentioned before, assume that we set the alpha to be 0.05 before we began the experiment, the result obtained is statistically significant since the p-value of 0.03 is lower than the alpha.
For reference purposes, below are the basic steps for the whole experiment:
- State the null hypothesis
- State the alternative hypothesis
- Determine the value of alpha to be used
- Find the Z-score associated with your alpha level
- Find the test statistic using this formula
- If the value of test statistic is less than the Z-score of alpha level (or p-value is less than alpha value), reject the null hypothesis. Otherwise, don’t reject the null hypothesis.
If you want to know more about statistical significance, feel free to check out this article — Statistical Significance Explained written by Will Koehrsen.
Final Thoughts

Thank you for reading.
There’s a lot of stuff to digest here, isn’t it?
I can’t deny that p-values are inherently confusing for many people, and it took me quite a while to really understand and appreciate the meaning of p-values and how they can be applied as part of our decision making process as a data scientist.
But don’t rely too heavily on p-values as they only aid in a small part of the whole decision making process.
I hope you’ve found the explanation of p-values intuitive and helpful in your understanding of what p-values really mean and how they can be used in your hypothesis testings.
At the end of the day, the calculation of p-values is simple. The hard part comes when we want to interpret the p-values in our hypothesis testings. Hopefully the hard part now becomes at least slightly easier for you.
If you want to learn more about statistics, I highly recommend you to read this book (which I’m reading it now!) — Practical Statistics for Data Scientists written specially for data scientists to understand the fundamental concepts of statistics.
As always, if you have any questions or comments feel free to leave your feedback below or you can always reach me on LinkedIn. Till then, see you in the next post! ????
Bio: Admond Lee is known as one of the highly sought-after data scientists and consultants in helping start-up founders and various companies tackle their problems using data with strong expertise in data science consulting and industry knowledge. You can connect with him on LinkedIn, Medium, Twitter, and Facebook or book a call appointment with him here if you are looking for data science consulting for your company.
Original. Reposted with permission.
Related:
- Top 10 Data Science Leaders You Should Follow
- How To Go Into Data Science: Ultimate Q&A for Aspiring Data Scientists with Serious Guides
- Simple Yet Practical Data Cleaning Codes