Market Basket Analysis: A Tutorial
This article is about Market Basket Analysis & the Apriori algorithm that works behind it.
The lifeblood of retail businesses has always been sales. A retailer can never assume that his customers know all of his offerings. But rather, he must make the effort to present all applicable options in way which increases customer engagement and increase sales.
Association Rule Mining
Association Rule Mining is used when you want to find an association between different objects in a set, find frequent patterns in a transaction database, relational databases or any other information repository. The applications of Association Rule Mining are found in Marketing, Basket Data Analysis (or Market Basket Analysis) in retailing, clustering and classification.
The most common approach to find these patterns is Market Basket Analysis, which is a key technique used by large retailers like Amazon, Flipkart, etc to analyze customer buying habits by finding associations between the different items that customers place in their “shopping baskets”. The discovery of these associations can help retailers develop marketing strategies by gaining insight into which items are frequently purchased together by customers. The strategies may include:
- Changing the store layout according to trends
- Customer behavior analysis
- Catalog design
- Cross marketing on online stores
- What are the trending items customers buy
- Customized emails with add-on sales etc..
Online retailers and publishers can use this type of analysis to:
- Inform the placement of content items on their media sites, or products in their catalog
- Deliver targeted marketing (e.g. emailing customers who bought products specific products with other products and offers on those products that are likely to be interesting to them.)
Difference between Association and Recommendation
Association rules do not extract an individual's preference, rather find relationships between sets of elements of every distinct transaction. This is what makes them different than Collaborative filtering which is used in recommendation systems.
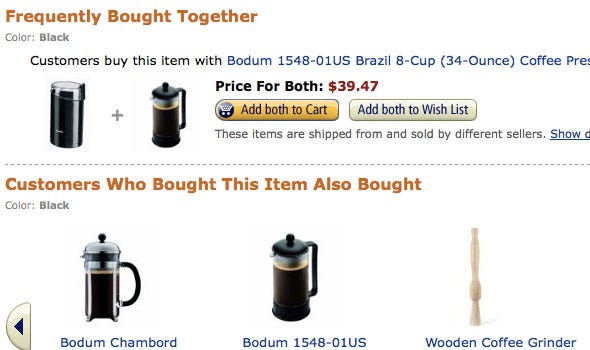
To understand it better take a look at below snapshot from amazon.com and you notice 2 headings “Frequently Bought Together” and the “Customers who bought this item also bought” on each product’s info page.
“Frequently Bought Together” → Association
“Customers who bought this item also bought” → Recommendation
Now to be very frank Market Basket Analysis is stupid simple. It really is: you’re effectively just looking at the likelihood of different elements occurring together. There’s more to it than that, but that’s the basis of this technique. We’re really just interested in learning how often things go together and how to predict when things will go together.
Apriori Algorithm
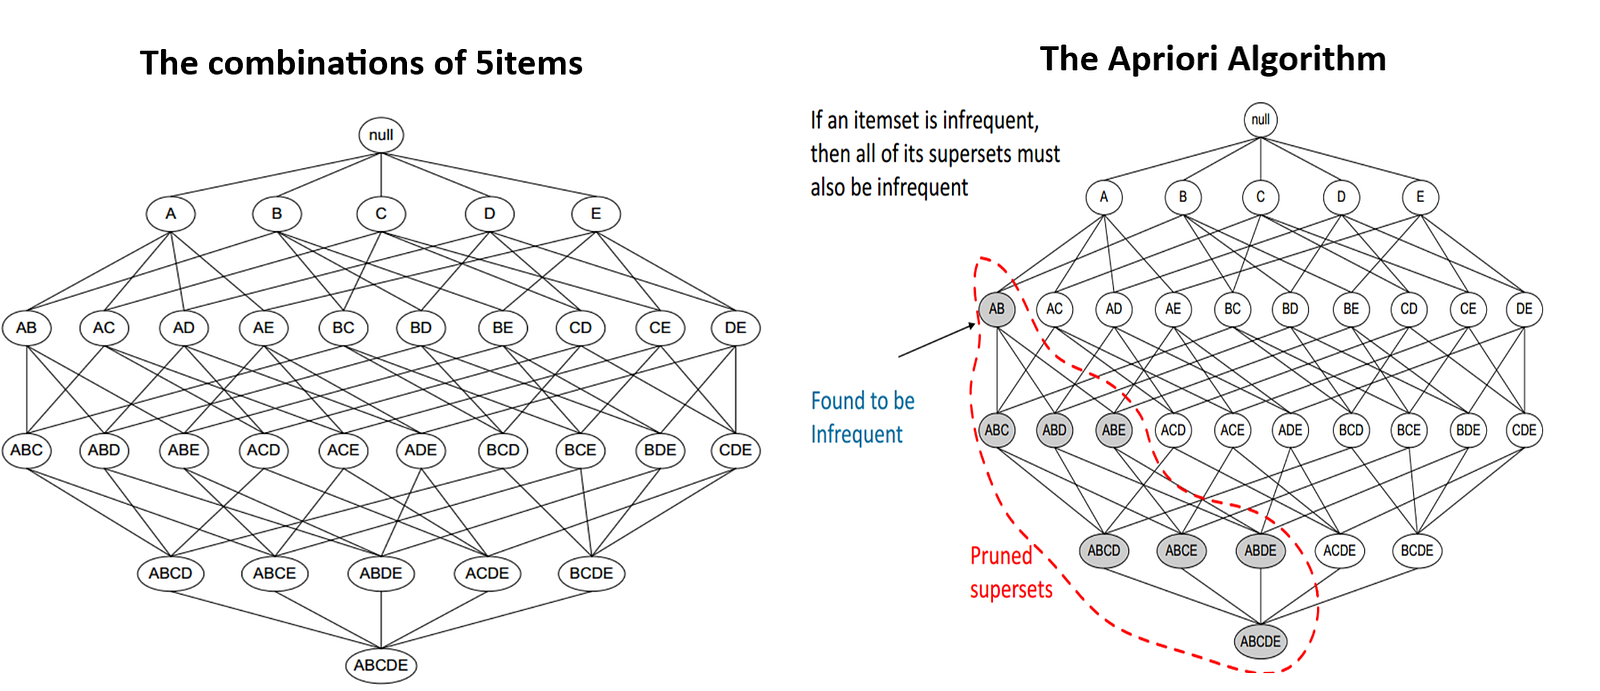
Apriori algorithm assumes that any subset of a frequent itemset must be frequent. Its the algorithm behind Market Basket Analysis.
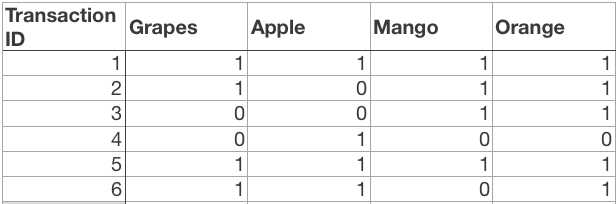
Say, a transaction containing {Grapes, Apple, Mango} also contains {Grapes, Mango}. So, according to the principle of Apriori, if {Grapes, Apple, Mango} is frequent, then {Grapes, Mango} must also be frequent.
Here is a dataset consisting of six transactions. Each transaction is a combination of 0s and 1s, where 0 represents the absence of an item and 1 represents the presence of it.
In order to find out interesting rules out of multiple possible rules from this small business scenario, we will be using the following matrices:
1. Support: Its the default popularity of an item. In mathematical terms, the support of item A is nothing but the ratio of transactions involving A to the total number of transactions.
Support(Grapes) = (Transactions involving Grapes)/(Total transaction)
Support(Grapes) = 0.666
2. Confidence: Likelihood that customer who bought both A and B. Its divides the number of transactions involving both A and B by the number of transactions involving B.
Confidence(A => B) = (Transactions involving both A and B)/(Transactions involving only A)
Confidence({Grapes, Apple} => {Mango}) = Support(Grapes, Apple, Mango)/Support(Grapes, Apple)
= 2/6 / 3/6
= 0.667
3. Lift : Increase in the sale of A when you sell B.
Lift(A => B) = Confidence(A, B) / Support(B)
Lift ({Grapes, Apple} => {Mango}) = 1
So, likelihood of a customer buying both A and B together is ‘lift-value’ times more than the chance if purchasing alone.
- Lift (A => B) = 1 means that there is no correlation within the itemset.
- Lift (A => B) > 1 means that there is a positive correlation within the itemset, i.e., products in the itemset, A, and B, are more likely to be bought together.
- Lift (A => B) < 1 means that there is a negative correlation within the itemset, i.e., products in itemset, A, and B, are unlikely to be bought together.
Association Rule-based algorithms are viewed as a two-step approach:
- Frequent Itemset Generation: Find all frequent item-sets with support >= pre-determined min_support count
- Rule Generation: List all Association Rules from frequent item-sets. Calculate Support and Confidence for all rules. Prune rules that fail min_support and min_confidence thresholds.
Limitation of Apriori algorithm
Frequent Itemset Generation is the most computationally expensive step because the algorithm scans the database too many times, which reduces the overall performance. Due to this, the algorithm assumes that the database is Permanent in the memory.
Also, both the time and space complexity of this algorithm are very high: O(2^{|D|}), thus exponential, where |D| is the horizontal width (the total number of items) present in the database.
Optimizing Apriori algorithm
Transaction reduction
We can optimize the existing apriori algorithm by which it will take less time and also works with less memory using these methods:
- Hash-based itemset counting: A k-itemset whose corresponding hashing bucket count is below the threshold cannot be frequent.
- Transaction reduction: A transaction that does not contain any frequent k-itemsets useless in subsequent scans.
- Partitioning: An itemset that is potentially frequent in DB must be frequent in at least one of the partitions of DB.
- Sampling: Mining on a subset of given data, lower support threshold + a method to determine the completeness.
- Dynamic itemset counting: add new candidate itemsets only when all of their subsets are estimated to be frequent.
Implementation of Apriori algorithm — Market basket analysis using python
The Retailer of a retail store is trying to find out an association rule between 20 items, to figure out which items are more often bought together so that he can keep the items together in order to increase sales.
You can download the dataset from here.
Environment setup: Python 3.x
pip install apyori
Load all the required libraries and the dataset.
import numpy as np
import matplotlib.pyplot as plt
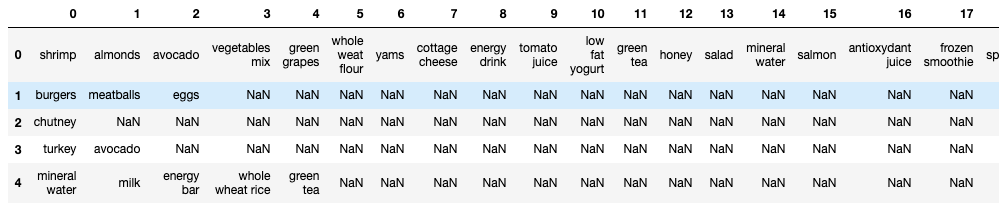
import pandas as pd
from apyori import aprioridataset = pd.read_csv('/Users/.../.../Market_Basket_Optimisation.csv', header = None)
Now, Convert Pandas DataFrame into a list of lists.
transactions = []
for i in range(0, 7501):
    transactions.append([str(dataset.values[i,j]) for j in range(0, 20)])
Build the Apriori model.
rules = apriori(transactions, min_support = 0.003, min_confidence = 0.2, min_lift = 3, min_length = 2)
Print rules:
print(list(rules))
Let us take a look at one rule:
RelationRecord(items=frozenset({'avocado', 'spaghetti', 'milk'}), support=0.003332888948140248, ordered_statistics=[OrderedStatistic(items_base=frozenset({'avocado', 'spaghetti'}), items_add=frozenset({'milk'}), confidence=0.41666666666666663, lift=3.215449245541838)]),
The support value for the first rule is 0.003. This number is calculated by dividing the number of transactions containing ‘avocado,’ ‘spaghetti,’ and ‘milk’ by the total number of transactions.
The confidence level for the rule is 0.416, which shows that out of all the transactions that contain both ‘avocado’ and ‘spaghetti’, 41.6 percent contain ‘milk’ too.
The lift of 1.241 tells us that ‘milk’ is 1.241 times more likely to be bought by the customers who buy both ‘avocado’ and ‘spaghetti’ compared to the default likelihood sale of ‘milk.’
Conclusion
In addition its popularity as a retailer’s technique, Market Basket Analysis is applicable in many other areas:
- In the manufacturing industry for predictive analysis of equipment failure.
- In Pharmaceutical/Bioinformatics for the discovery of co-occurrence relationships among diagnosis and pharmaceutical active ingredients prescribed to different patient groups.
- In Banking/Criminology for fraud detection based on credit card usage data.
- For analyzing customer behavior by associating purchases with demographic and socio-economic data.
More and more organizations are discovering ways of using market basket analysis to gain useful insights into associations and hidden relationships. As industry leaders continue to explore the technique’s value, a predictive version of market basket analysis is making in-roads across many sectors in an effort to identify sequential purchases.
Congratulations! You have learned the Apriori algorithm, one of the most frequently used algorithms in data mining. You have learned all about Association Rule Mining, its applications, and its applications in retailing called Market Basket Analysis.
Well, that is all for this article. I hope you guys have enjoyed reading it, please share your suggestions/views/questions in the comment section.
Thanks for reading !!!
Bio: Nagesh Singh Chauhan is a Data Science enthusiast. Interested in Big Data, Python, Machine Learning.
Original. Reposted with permission.
Related:
- Frequent Pattern Mining and the Apriori Algorithm: A Concise Technical Overview
- Top 10 Machine Learning Algorithms for Beginners
- A Friendly Introduction to Support Vector Machines