What Do Data Scientists in Europe Do & How Much Are They Worth?
Interested in knowing what a data scientist is worth in Europe, and what one does? Read this overview of a recent survey on the topic and gain some insight into the European data science professional job market.
In December, we shared some insight into what a data scientist is worth, with data mainly focused on the United States, with some additional geographic data sprinkled in for good measure. With the recent release of Big Cloud's annual survey reports on data science professionals by geographic region, we now have some quality data and visualizations to help us gain a better understanding of what data scientists are worth worldwide.
We will have a look at Europe this time around, specifically the skills that data science professionals report to be using, salaries for these professionals, and insights of interest from the report.
From Big Cloud's report:
Since 2016, Big Cloud has committed to producing some of the biggest and best Data Science salary reports year on year. Over 1300 responses and 33 questions later, we are proud to announce this is the most data-rich survey for Europe we have curated to date!
This report will delve into insights for 2019/2020 provided from professionals of all backgrounds, ages and locations within the European region. The largest share of contributions this year were from Germany, France, UK, Netherlands and Switzerland. Because these were our greatest data points, these countries are the primary focus for us in this report.
More specifically, the majority of respondents came from the following cities:
- Paris
- Berlin
- Munich
- London
- Amsterdam
- Hamburg
- Zurich
- Cambridge
- Frankfurt
- Madrid
Who were the respondents?
The largest group of people to take part in our survey this year were 24% of male Data Scientists aged between 25-34. Compared to last year, there appears to be a greater variation in roles, with a 15% decrease in the number of Data Scientists, a 6% increase in the number of Data Engineers and a 3% increase in the number of C-Level participants.
The ratio of male to female participants remains unchanged.
Over half of those that took part in this survey hold a Masters degree, followed by a steady increase year on year amongst PhD (+4%) and Bachelors degree (+2% participants). There is a continued decline in those that opt to study however, making up just 3% of respondents this year. (2018 saw 3.45%)
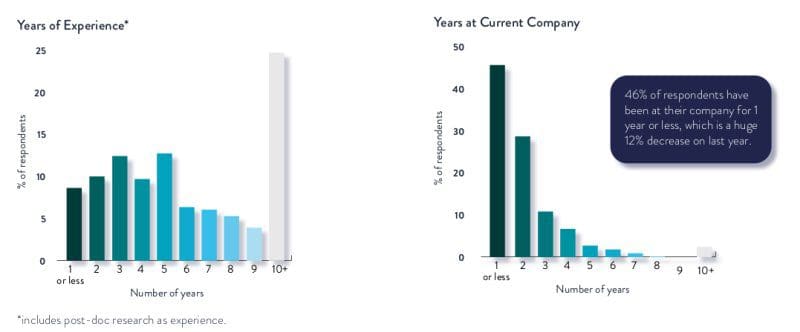
The years of experience and years at current company of respondents are shown in Figure 1.
The top industries for survey respondents were:
- Technology/IT
- Consulting
- E-Commerce
- FinTech
- Academia/Education
- Software
- Healthcare
- Insurance
- Automotive
- Marketing
Note that the underlying data upon which this report is based is unavailable.
Now that we have an idea of the survey participants, let's have a look at the report, starting with skills.
Data Science Skills
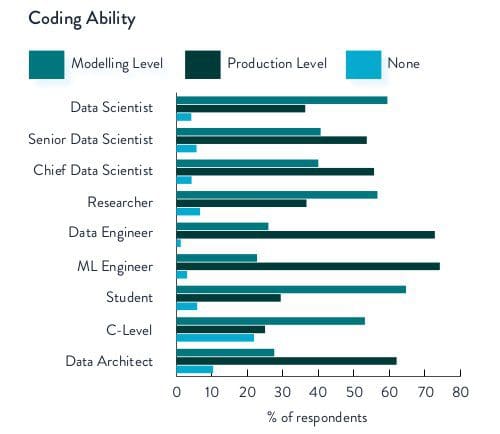
Some of the data science skills dimensions investigated by the survey are coding languages, coding ability, and methods used.
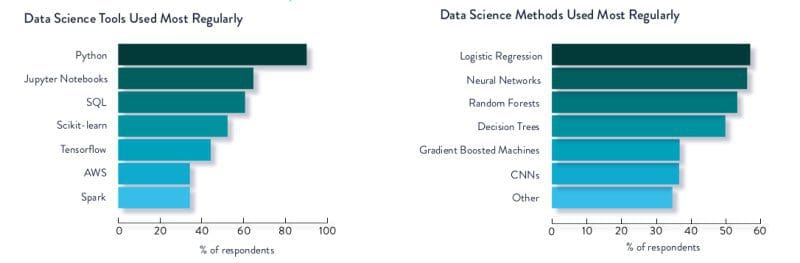
When it comes to data science methods, the following was gleaned from participants:
[L]ogistic regression, neural networks and random forests were the top three most popular choices with roughly 56% of respondents claiming to use them. Compared to a Data Scientists tool preferences, there is a much greater variety amongst their chosen data science methods. Other options in the survey (that didn’t make it to the top seven shown above) were 34% ensemble, 31% Bayesian techniques and 28% SVMs.
Specific to coding, the respondents' data tells the following story:
[A] huge 70% of respondents saying they use Python as their primary modelling coding language. This is a 10% increase on our 2019 survey. 9% use R, 4% use SQL, and 4% use Java. There were also 3% of respondents that said they don’t code.
66% of respondents said their primary production coding language is also Python. A further 9% said Java, as well as 7% either using Scala or not coding at all. 6% use C++
How much time do respondents spend coding?
29% of respondents spend 11-20 hours a week coding which is the same as shown in our 2019 survey. Only 14% of respondents said they spend 31+ hours coding weekly, compared to 7% not coding at all. Overall the response was pretty varied, which could be indicative of the diversity in seniority of participants.
Respondents also note that the most popular types of data being worked with, in order, are:
- Relational Data
- Text Data
- Image Data
- Other
- Video Data
Data Science Salaries
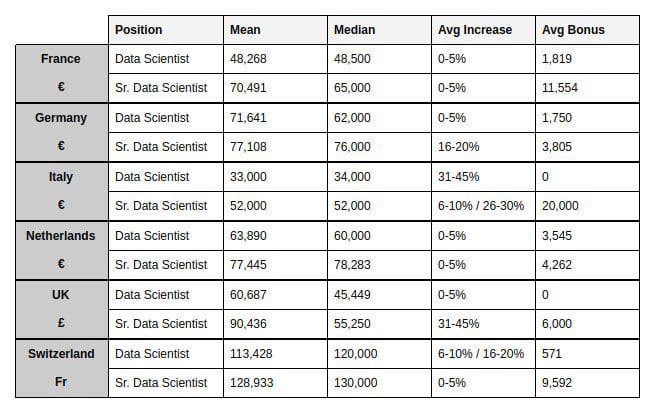
While the survey contains salary data for a number of different data science related roles, this quickly moves into the territory of comparing apples to oranges. In order to draw meaningful comparisons, we will look at the data points of "data scientist" and "senior data scientist" mean salary, median salary, average increase, and average bonus for each of the 6 countries (France, Germany, Italy, Netherlands, Switzerland, UK) with the highest numbers of respondents (see Figure 4), countries which the report, itself, highlights.
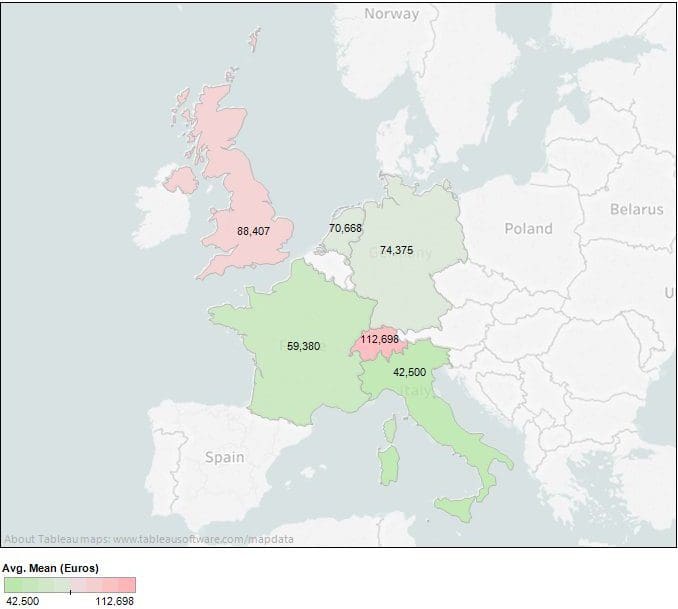
Let's map this data. Figure 5 visualizes the mean salary for the 6 countries in the above chart, with local currencies converted to their value in euros at the time of this article's publication.
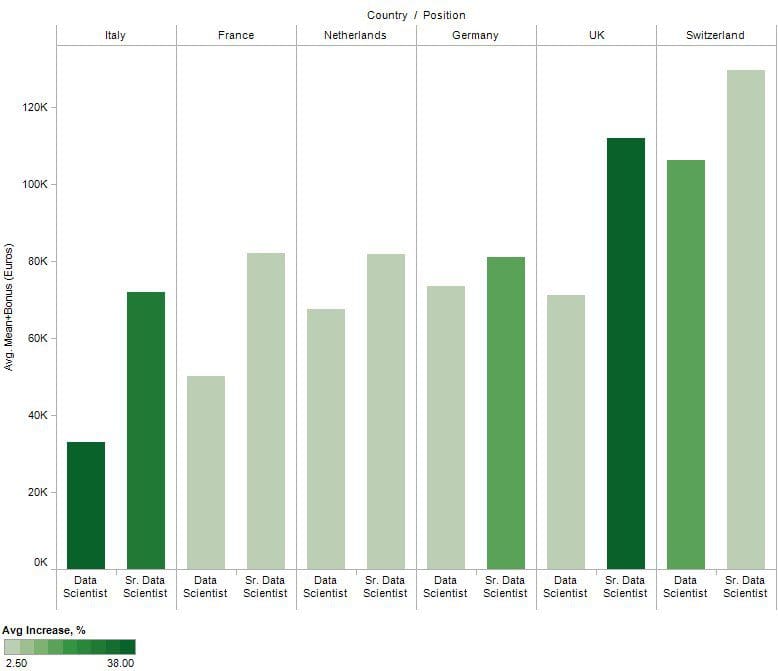
In order to paint a more complete picture of what a European data scientist is worth, Figure 6 graphs the mean salary + bonus (in euros) of data scientists and senior data scientists in the same 6 countries, as well as depicting the salary increase percentage by bar color intensity.
When it comes to compensation satisfaction, results were not overwhelming; however, slightly more than half of respondents seemed to think their salary and benefits package was satisfactory.
When asked, "On a Scale of One to Ten (With Ten being the easiest), How Easy Would it be for you to Find a New Job?" the most common response was "3" from survey participants.
Conclusions
Europe is certainly not a monolith, and this is evident in the survey responses. There are salary discrepancies between countries, to be sure, but this does not, itself, tell a complete story without consideration given to cost of living differences. While should be obvious and is beyond the scope of a salary survey, it is worth noting explicitly.
One item that sticks out beyond the raw numbers was participants' perception that availability of alternate data science positions and ease of being able to transfer into one seemed relatively low. That is a personal perception, but when it comes to deciding whether or not to search for a new role, perception is just as important as reality.
You can read the entire report for yourself here.
Related:
- What is a Data Scientist Worth?
- Artificial Intelligence: Salaries Heading Skyward
- Data Scientists: Why are they so expensive to hire?