 The Death of Data Scientists – will AutoML replace them?

 The Death of Data Scientists – will AutoML replace them?
Soon after tech giants Google and Microsoft introduced their AutoML services to the world, the popularity and interest in these services skyrocketed. We first review AutoML, compare the platforms available, and then test them out against real data scientists to answer the question: will AutoML replace us?
By Joseph Chin, Aifaz Gowani, Gabriel James, and Matthew Peng, all students in MS in Business Analytics at UT Austin.
Here are the results of KDnuggets Poll, partly inspired by this blog:
When Will AutoML replace Data Scientists? Poll Results and Analysis

A brief history of AutoML platforms.
Introduction of AutoML
One cannot introduce AutoML without mentioning the machine learning project’s life cycle, which includes data cleaning, feature selection/engineering, model selection, parameter optimization, and finally, model validation. As advanced as technology has become, the traditional data science project still incorporates a lot of manual processes and remains time-consuming and repetitive.
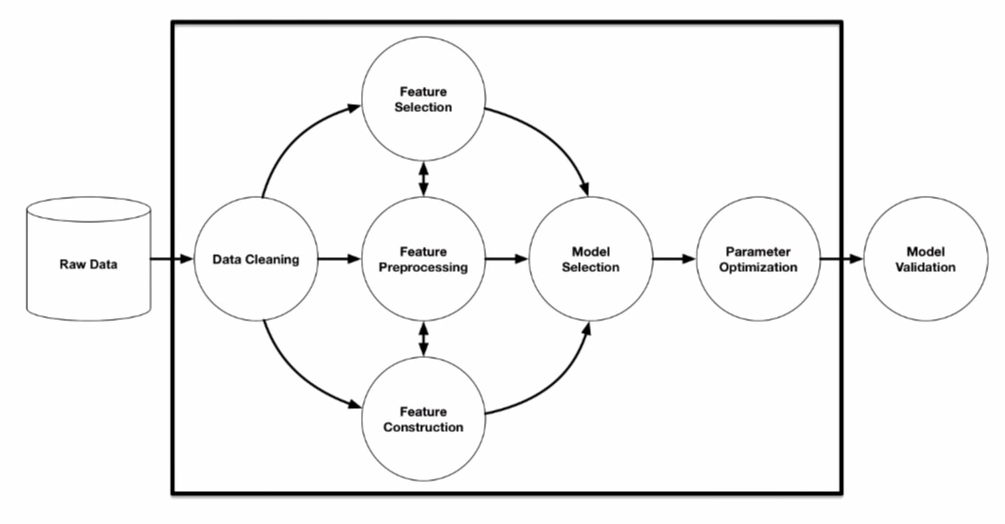
Source: R. Olson et. al. (2016) “Evaluation of a Tree-based Pipeline Optimization Tool for Automating Data Science.”
AutoML came into the picture to automate the entire process from data cleaning to parameter optimization. It provides tremendous value for machine learning projects in terms of both time savings and performance.
What AutoML Platforms are Available?
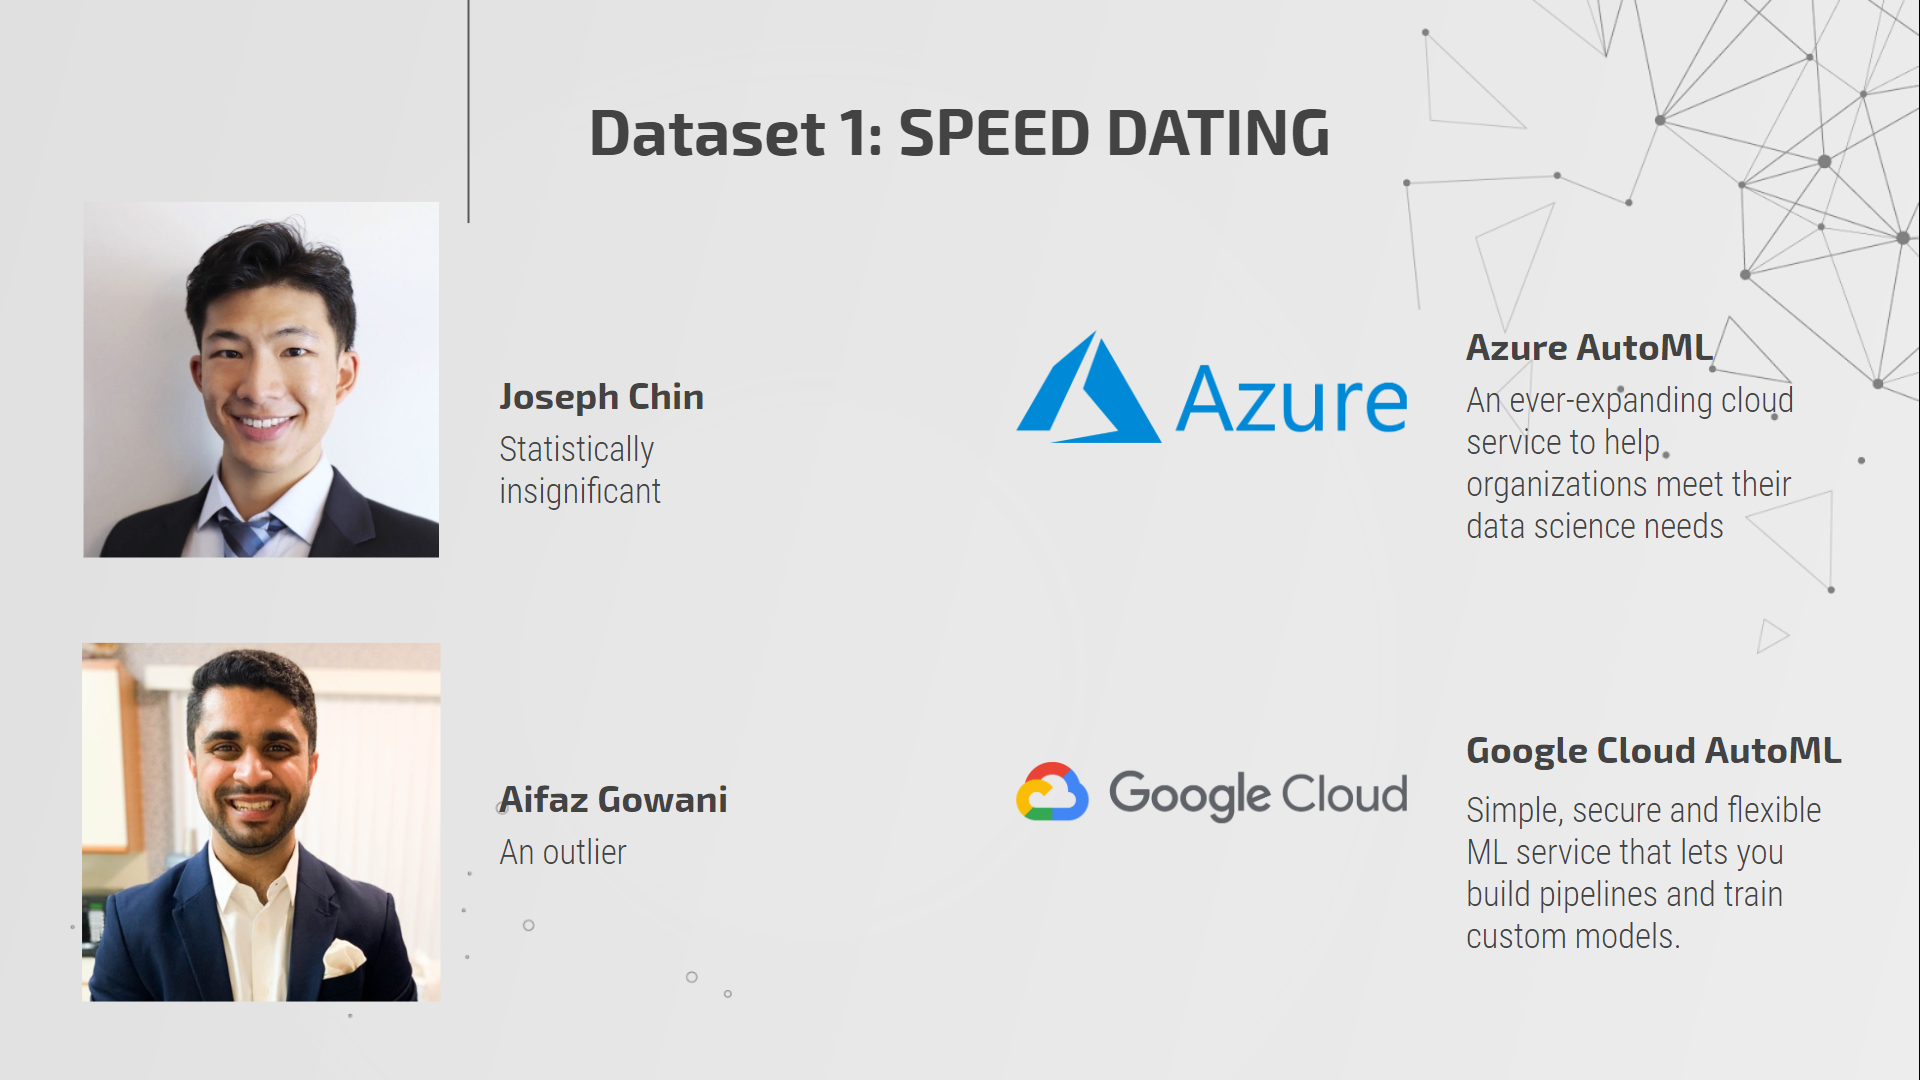
1. Google Cloud AutoML
Launched in 2018, Google Cloud AutoML quickly gained popularity with its user-friendly interface and high performance. The chart below is a demonstration of Google’s performance (blue bars) comparing to other AutoML platforms.

Source: Tackling High-Value Business Problems Using AutoML on Structured Data (Cloud Next ‘19).
2. Microsoft Azure AutoML
Also released in 2018, Azure AutoML offers a transparent model selection process to its users who are not familiar with coding.
3. H2O.ai
“H2O has been the driver for building models at scale. We are talking about billions of claims. You can’t do this with standard off the shelf open source techniques.“ — H2O.ai
H2O was founded in 2012 and offers both an open-source package and a commercial AutoML service called Driverless AI (since 2017). Since its inception, H2O has been widely adopted in industries, including financial services and retail.
4. TPOT
TPOT (Tree-based Pipeline Optimization Tool) was developed by the University of Pennsylvania and is a Python package that is free to use. Albeit free, the package is extremely powerful and has achieved outstanding performance in various datasets: around 97% accuracy for the Iris dataset, 98% for MNIST digit recognition, and 10 MSE for Boston Housing Prices prediction. (source: TPOT documentation)
AutoML vs. Data Scientists
Now that we know what AutoML is and what options are available, we will address the elephant in the room: are these platforms going to replace human data scientists? We will look at this problem from the cost perspective and run a hackathon to evaluate AutoMLs’ performances compared to humans’.
Costs Comparison
According to Indeed.com, the average annual salary for data scientists in the U.S. is $121,585. In the meantime, if a company hires an AutoML for a full-time position (40 hours per week, 52 weeks per year), the cost would range from $4,160 to $41,600 per year, depending on the platform it chooses.
Granted, this is not a scientifically sound comparison, as we all know that data scientists do way more than just run models. However, it is a very quick and simple way to show where data scientists and AutoML stand in terms of costs.
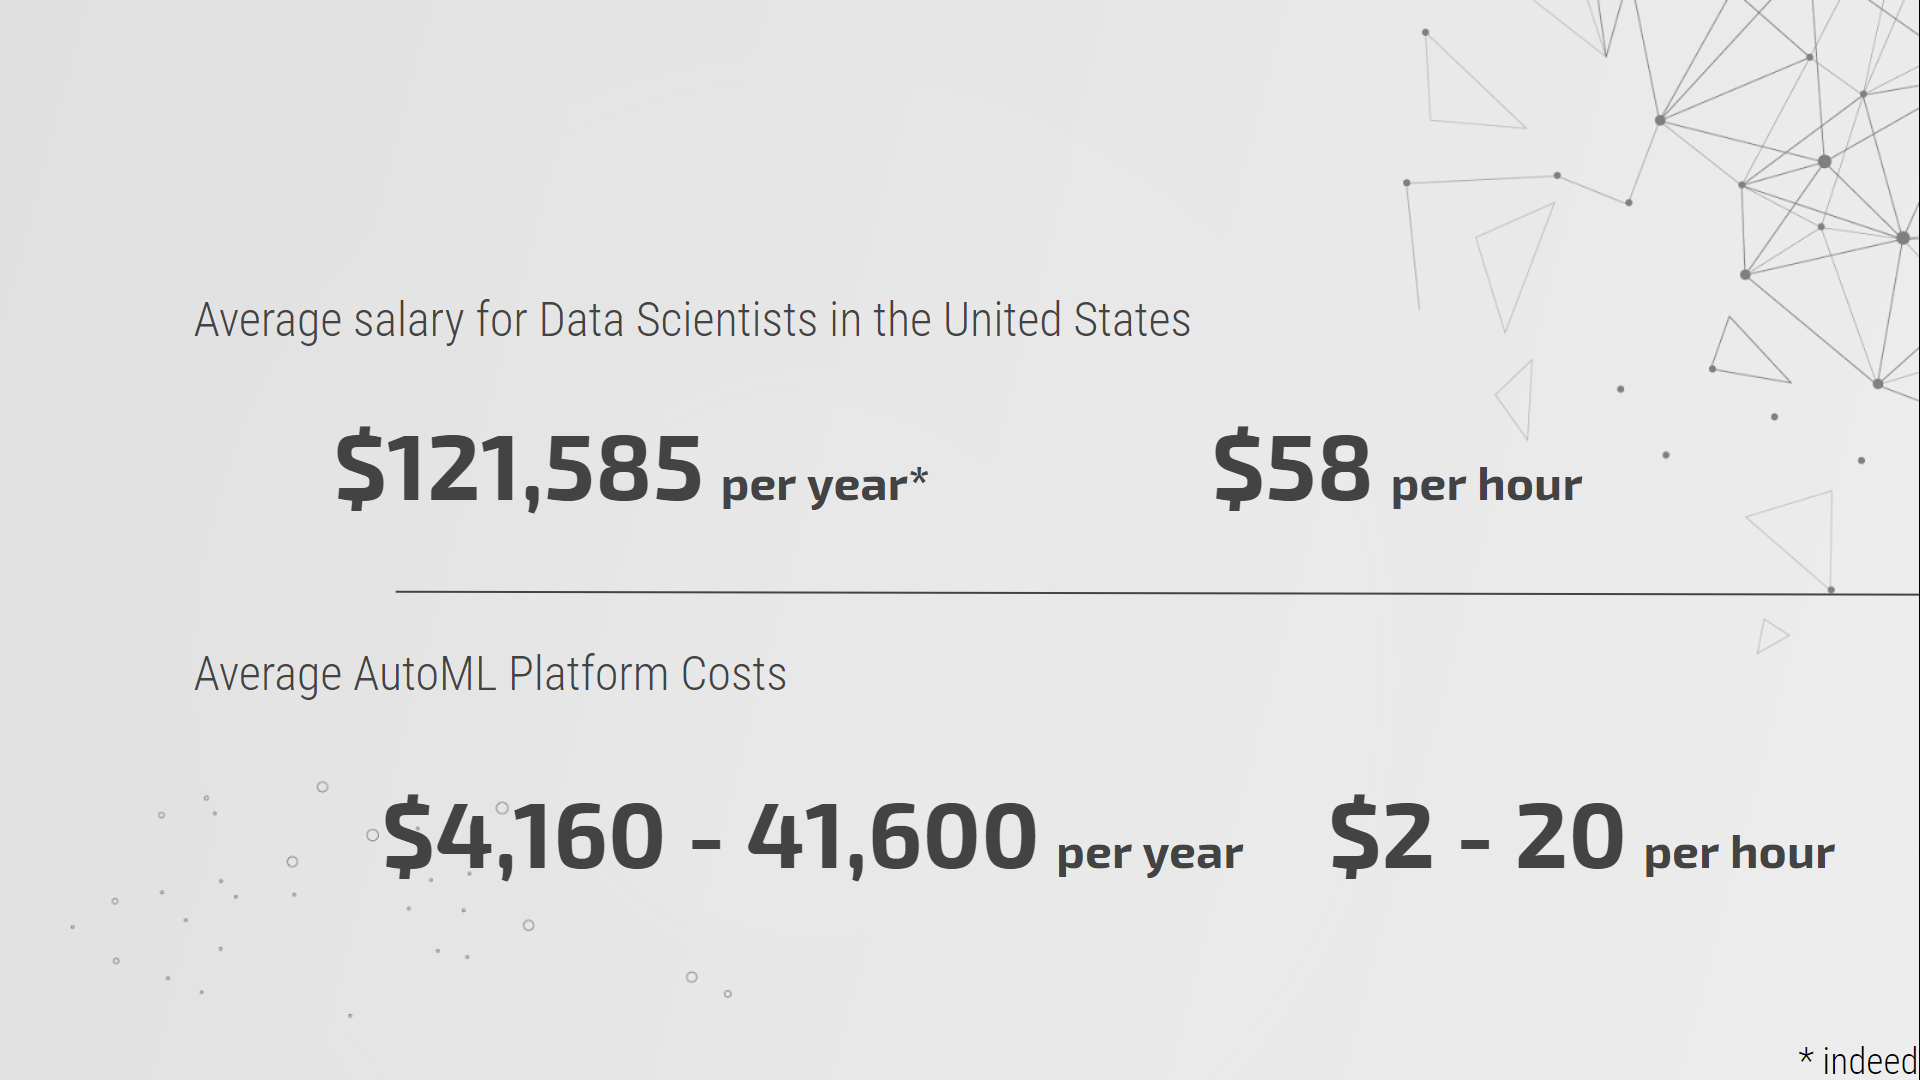
Data Scientists vs. AutoML Cost Comparison.
Performance Comparison: Hackathon
We will continue to compare the performance of human data scientists with AutoML platforms by running a hackathon with two datasets. In each dataset, a team of human data scientists will be competing against AutoML platforms. Both teams will go through data processing, feature selection/engineering, model selection, and parameter tuning to come up with the best prediction result with a predetermined performance metric.
Hackathon Dataset 1: Speed Dating (Classification).

Hackathon Dataset 2: ASHRAE (Regression).
Dataset 1: Speed Dating Dataset
Dataset Overview
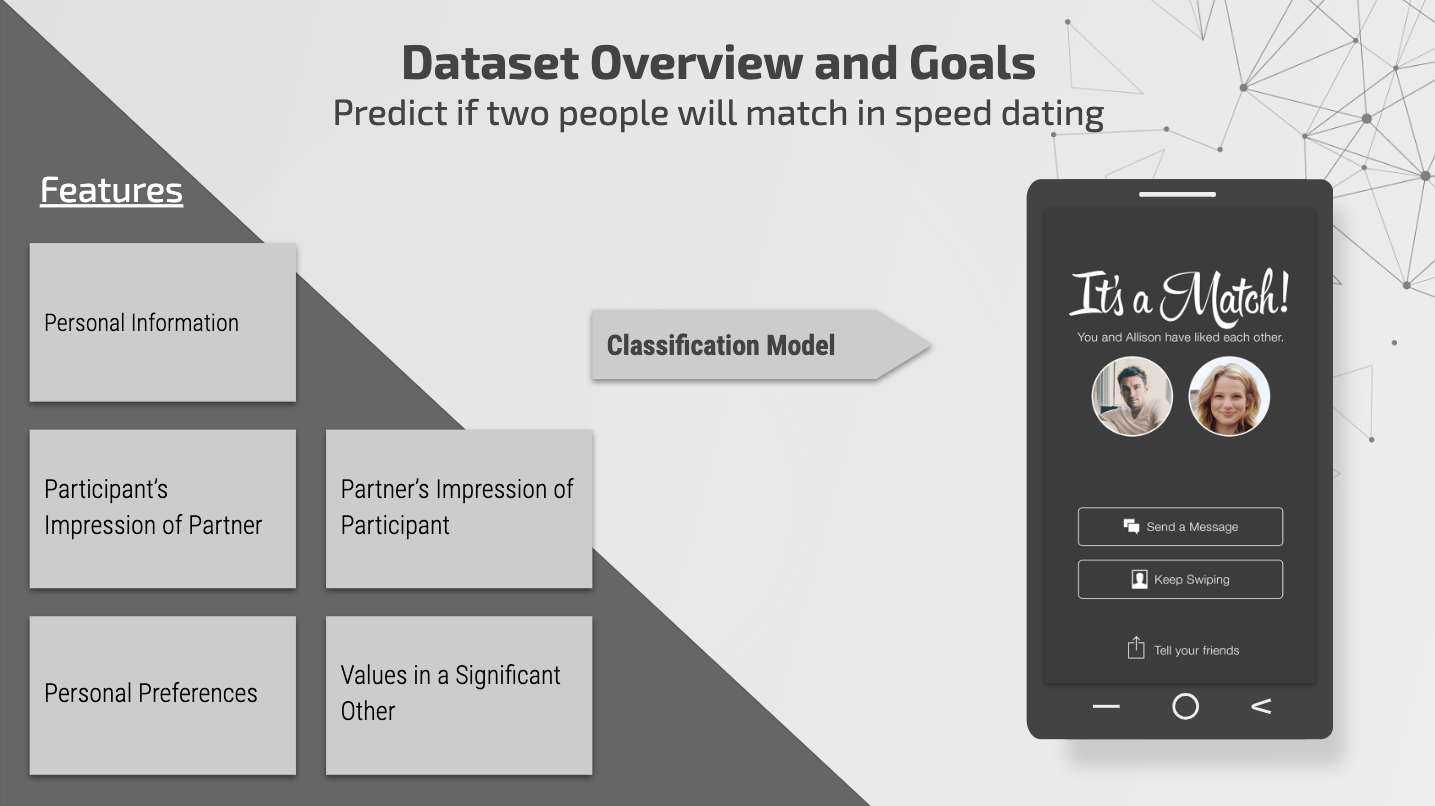
This dataset was gathered from participants in experimental speed dating events. During these events, the attendees would fill out a survey that included information about themselves and the things they look for in their partner. For example, how ambitious do they rate themselves on a scale of 1–10, what are the activities they are involved in, how ambitiousness do you want your partner to be. The goal of this dataset was to predict whether an individual will be able to find a match based on their preferences as features. This was a classification problem with the “match” variable as our dependent variable.
Data Preprocessing and Feature Engineering by Data Scientists
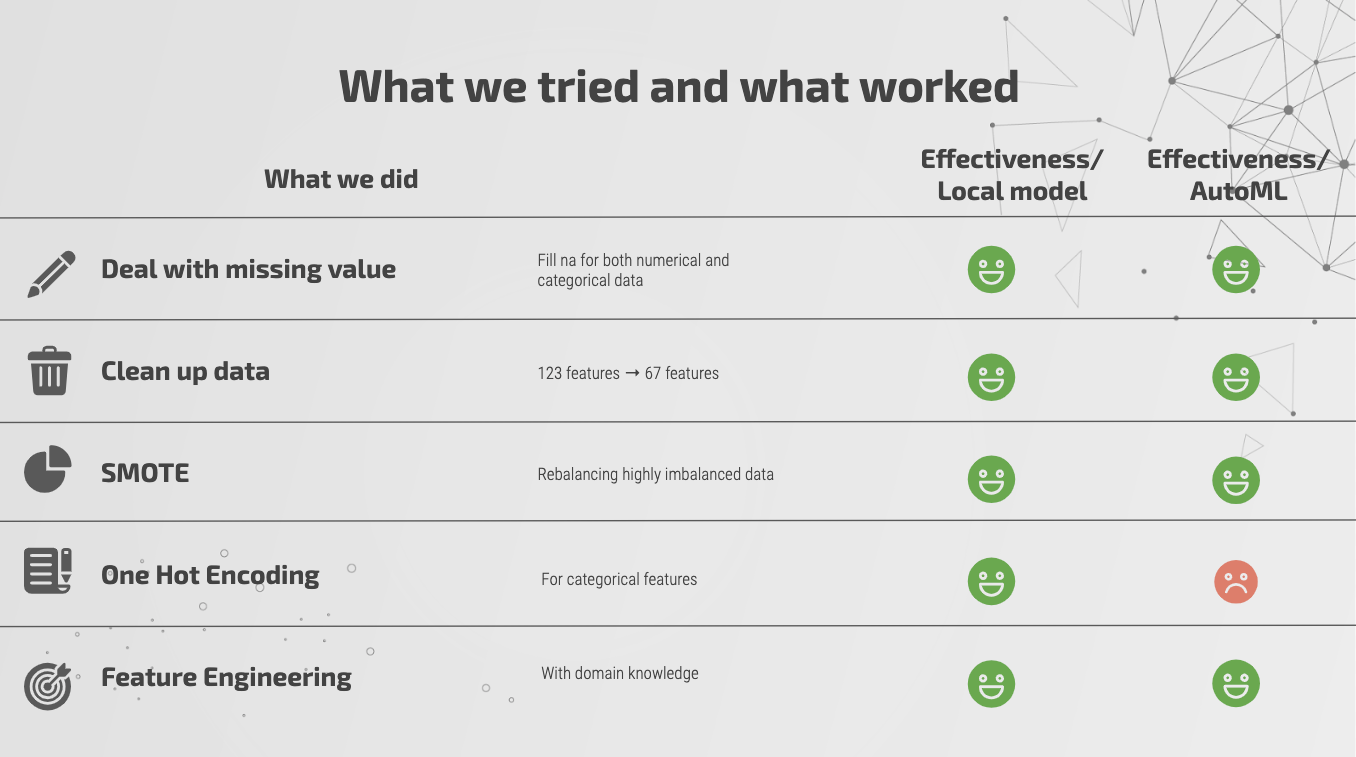
In order to receive better results than the AutoML platforms, we needed to feature engineer our dataset, deal with class imbalance problems, deal with missing values, and perform one-hot encoding for the categorical variables. Because the data was collected through a survey, we faced the issue of missing values throughout our dataset. If the individual did not participate or felt comfortable answering the question, they simply left it blank. These missing values were taken care of by imputing mean, median, or mode as seemed appropriate. The data had collinearity amongst some independent variables. Therefore certain variables were dropped. Only 29% of the dependent label had a binary value of 1, while others were 0. In order to deal with this problem, we used SMOTE (Synthetic Minority Oversampling Technique). SMOTE creates synthetic samples from the minority class instead of simply copying the data. One-hot encoding variables, in particular, have trouble on Google’s platform because the platform is not able to group them in a manner to extract meaningful information.
We will now use the raw and feature engineered data to conduct analysis on the overall effectiveness of Azure and Google’s AutoML platforms.
Data Scientists vs. AutoML Platforms
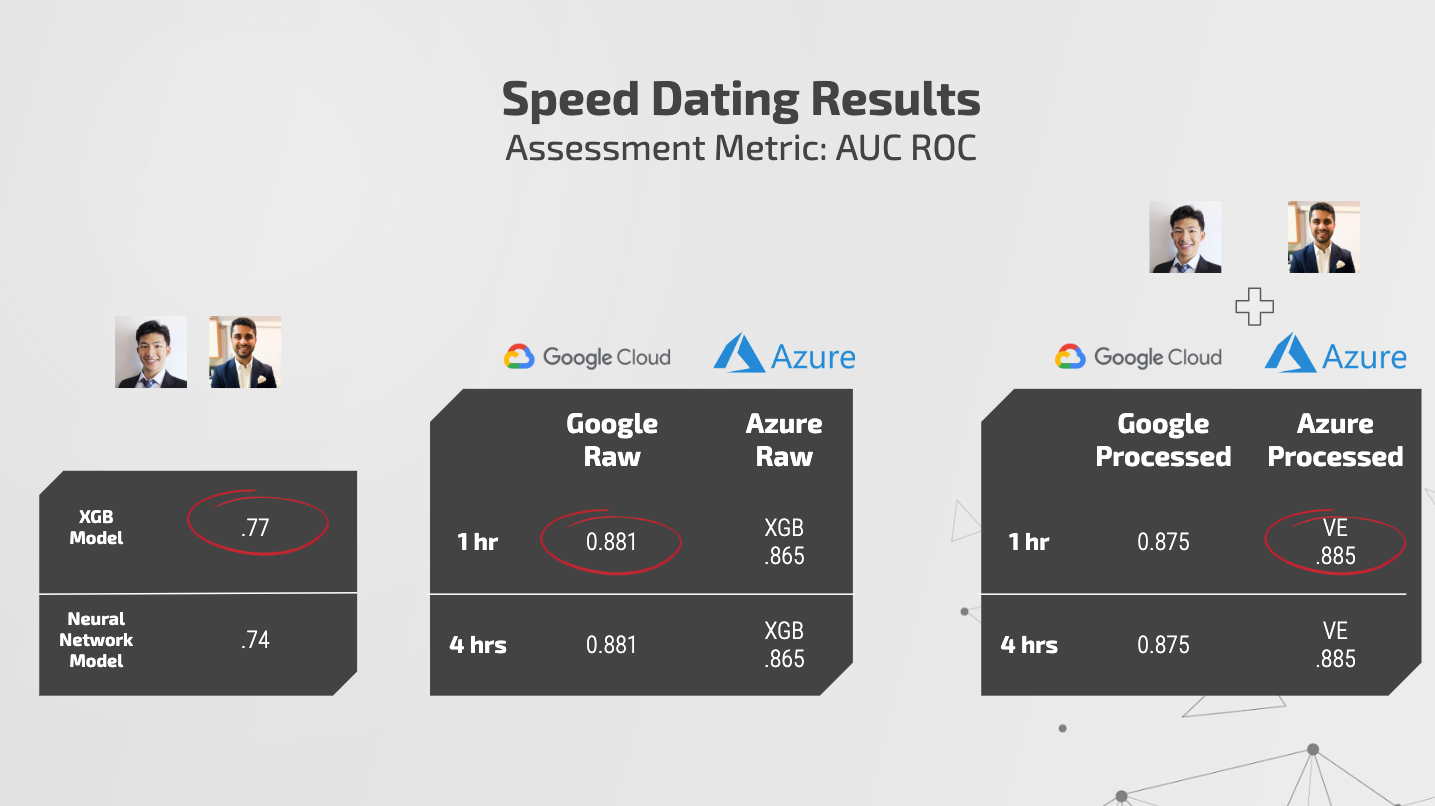
Data Scientists: We tried several different models and came to noticed that XGBoost and Neural Network models perform the best. We are looking at the AUC ROC scores here in order to compare the results by our model vs. the models created by these AutoML platforms. We received an AUC ROC score of .77 with our XGBoost model and .74 with our neural network model.
AutoML Platforms on Raw Data: Google performed a little bit better than Azure’s XGBoost model. Google received an AUC ROC score of .881 while Azure obtained an AUC ROC score of .865. Google’s platform does not inform us about which model has been chosen as the best one as that information is considered proprietary. On the other hand, Azure tells you exactly how many models were run, what were the scores under each model, and the time it took to train each model.
AutoML Platforms on Processed Data: We now want to measure the performance on our feature engineered dataset. There are a couple of things we notice: Google’s performance has decreased, and Azure’s performance has increased. As mentioned earlier, one-hot encoding has a problem for Google’s AutoML and the platform is created to perform its own feature engineering. Therefore, providing the feature engineered data with one-hot encoded variables decreased the overall performance. Azure’s performance increased from .865 to .885.
Here is a picture of the models that Azure ran on this dataset:

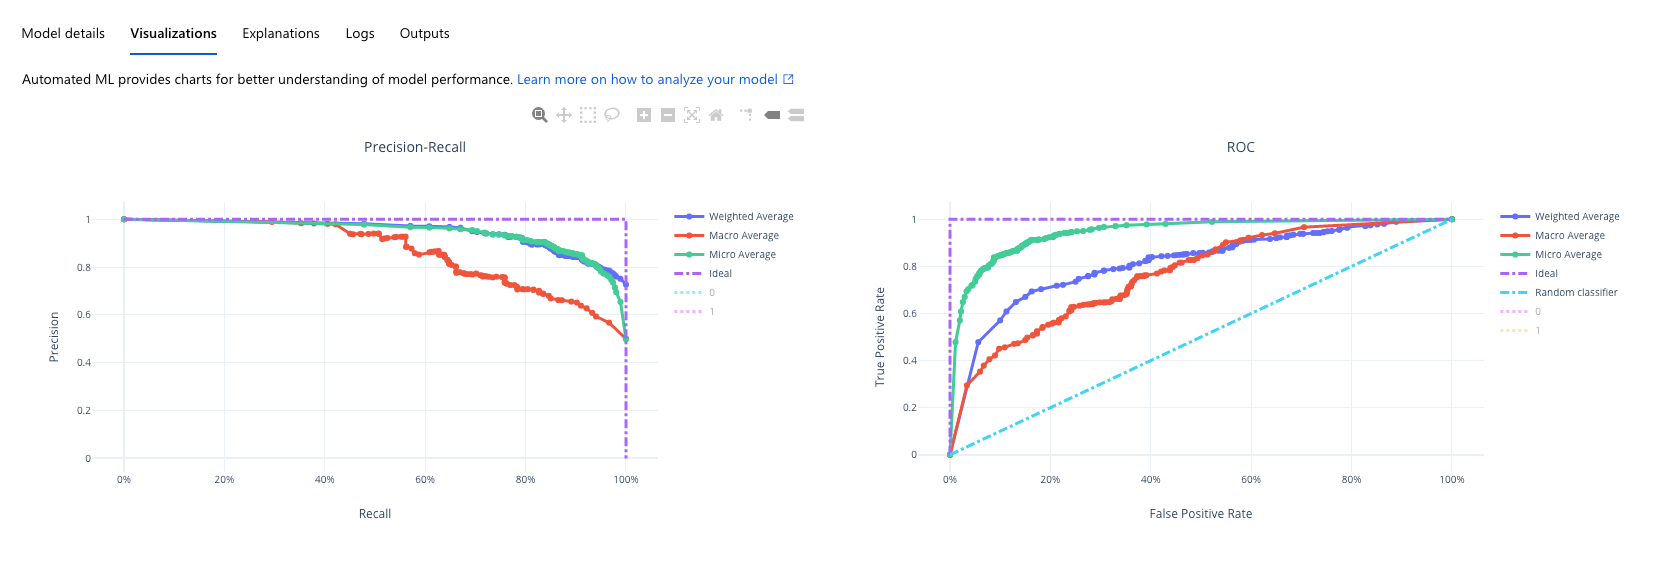
You can also view the Precision-Recall graphs, ROC graph, confusion matrices, and feature importance plots on Google’s and Azure’s platforms:
Takeaways from Speed Dating Dataset:
- Data Scientists can add value by providing well feature engineered datasets to AutoML platforms.
- Azure is more transparent in informing which model was used in the prediction; Google’s model creation and selection information are proprietary.
- Google does not handle one-hot encoded variables well.
Dataset 2: ASHRAE
Dataset Overview
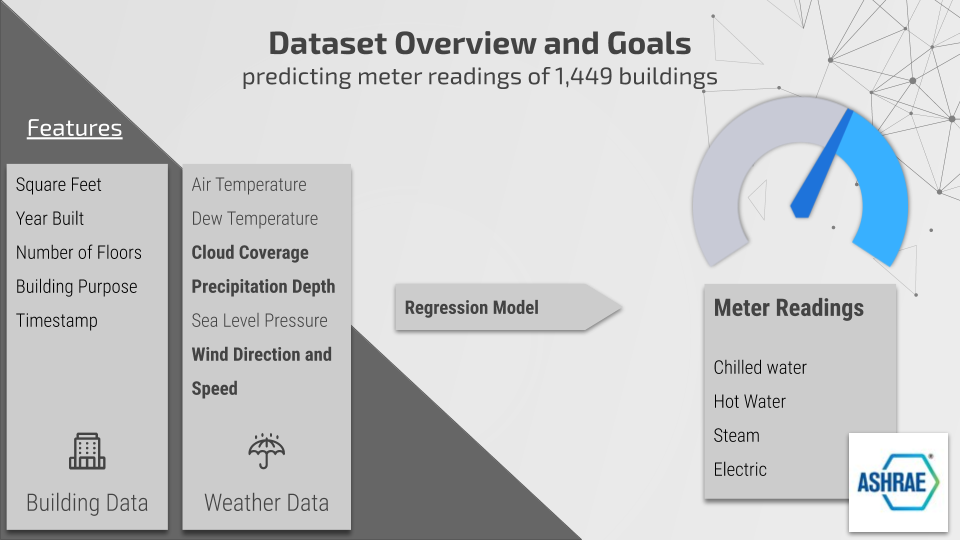
This dataset came from the ASHRAE Energy Prediction Kaggle competition, which challenged participants to develop predictive models for hot water, chilled water, steam, and electric meter readings for 1,449 buildings. The data consisted of metadata about the buildings, including square footage, year built, and floor count; meter type and readings by timestamp; and weather data, including air temperature, cloud coverage, precipitation depth, wind speed, wind direction in degrees, and sea level pressure, by timestamp. The weather data were collected at a site level by the nearest meteorological station.
Data Preprocessing and Feature Engineering by Data Scientists
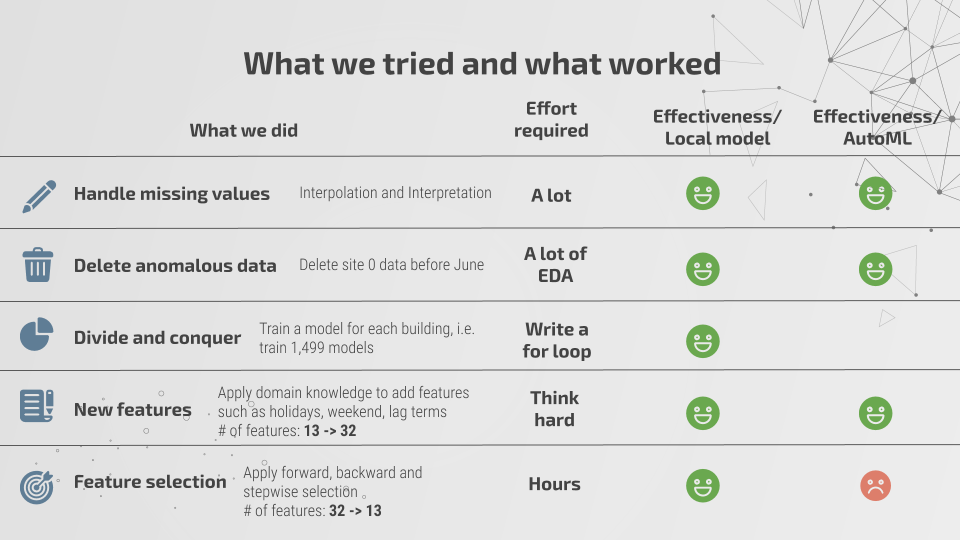
Missing values in the weather dataset were a substantial problem to tackle, as the cloud coverage and precipitation depth features were missing 50% and 35% of values, respectively. Some meteorological sites were missing all cloud coverage and precipitation depth data. To overcome this obstacle, we attempted to interpolate missing values in the air temperature, dew temperature, wind speed, and sea level pressure features, which contained very few null values and use the interpolated data to develop a predictive model for cloud coverage and precipitation depth.
We selected interpolation methods for each feature using 10-fold cross validation and applied them to our train and test data. We ran a series of models to predict cloud coverage and precipitation depth but were unsuccessful in finding a model accurate enough to generate the missing values. Wind direction was reconstructed as a set of categorical variables by interval, and we log-transformed wind speed because of its heavy right skew. Additionally, we constructed features such as holidays, weekends, and lag terms of our features. In total, we built 19 features on top of our 13 original, for a total of 32 variables.
Last, we removed anomalous weather data collected at one of the meteorological sites and then applied forward, backward, and stepwise selection to identify the best features to predict with, ultimately, using 13 of our 32 variables.
Data Scientists vs. AutoML Platforms
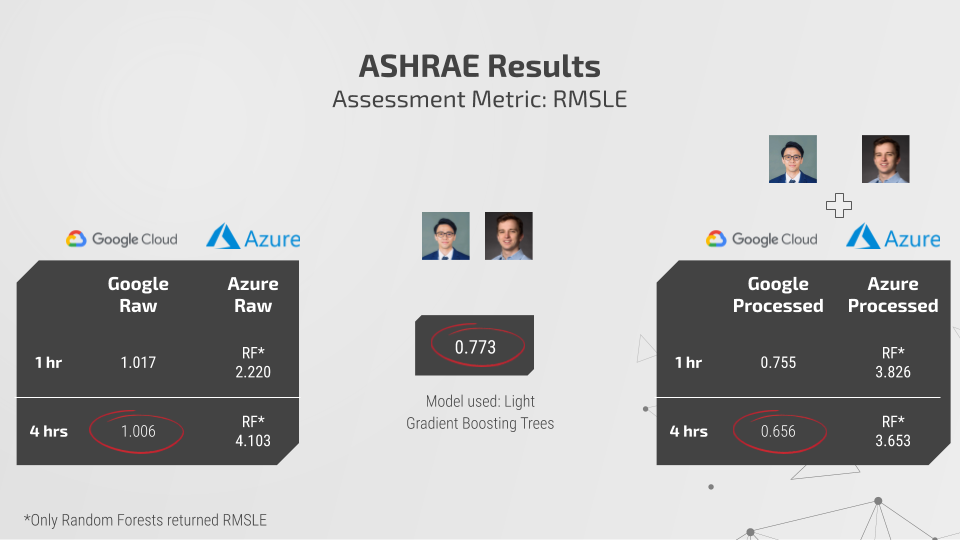
Data Scientists: Instead of creating a general model for all buildings, we constructed a Light Gradient Boost model for each building in our dataset, since the training and test sets contained the same buildings. We achieved an RMSLE of 0.773 with this approach.
AutoML Platforms on Raw Data: With an hour of training time, Google Cloud achieved an RMSLE of 1.017; training an additional 3 hours improved the RMSLE by 0.011. Google handily outperformed Azure, which achieved an RMSLE of 2.22. This isn’t an entirely fair comparison, as we restricted Azure to Random Forests because only this method would return an RMSLE.
AutoML Platforms on Processed Data: We ran the processed data through Google Cloud and were surprised when, after 4 hours of training, Google Cloud achieved an RMSLE of 1.7. Upon further investigation, we discovered that our feature selection method was inhibiting the AutoML’s performance, as AutoML platforms will perform their own feature selection. We ran the processed data through both platforms again, with all 32 variables instead of only 13. This time, both platforms’ performances improved. Google Cloud achieved an RMSLE of 0.755 after an hour of training and an RMSLE of 0.656 after four hours, a significant improvement upon the data scientists’ performance! Azure achieved an RMSLE of 3.826 with one hour of training and 3.653 after four.
Takeaways from ASHRAE Dataset:
- Though AutoML is a powerful tool for prediction, it cannot preprocess data well enough to consistently outperform a human.
- A few extra hours of training can considerably increase the performance of an AutoML platform.
- Allow AutoML platforms to select features for you; otherwise, you run the risk of heavily restricting the platform’s performance.
- Combining a data scientist’s expertise of the business problem with AutoMLs’ feature selection, feature preprocessing, model selection, and hyper-parameter tuning capabilities is a potent solution to deriving valuable insights and strong predictive results.
Conclusion and Key Takeaways
Finally, we would like to conclude our project by answering three questions.
Will AutoML replace data scientists?
The answer is NO.
While AutoMLs are good at building models, they are still not capable of doing most of a data scientist’s job. We still need data scientists to define business problems. We still need data scientists to apply their domain knowledge to generate more useful features. AutoML nowadays can only deal with limited types of problems such as classification and regression problems. Currently, they do not have the capability to build recommendation and ranking models. Most importantly, we still need data scientists to draw actionable insights from the data, and it can not be done by AutoMLs alone.
However, AutoMLs are still strong tools for data scientists to create values for their stakeholders. So the next obvious question to ask is: How and when should we use AutoML?
When can data scientists best leverage AutoML platforms?
Here we would like to mention some examples that might be worth considering.
- Performance over interpretability:
Sometimes, the stakeholders may only care about the precision of models, and the interpretability is not the most crucial consideration. Based on our experiments, it seems that AutoMLs, together with reasonable feature engineering, can achieve satisfactory performance. However, in our examples, the interpretability was limited to feature importance for both platforms. In other words, if the feature importance is sufficient for your problem, then AutoMLs might be the right choice for higher precision.
- Speed to production:
Both Google and Azure provide convenient ways to deploy your models into production. For example, Google Cloud allows batch prediction and online prediction with just a few clicks. It also allows you to deploy your model to your website using their API. These features can enable data scientists to speed up the production process and reduce the efforts.
- Better use of your time:
Data scientists have a plethora of responsibilities that can be overwhelming. As a data scientist, time can be your scarcest resource. Your days are occupied by numerous meetings with stakeholders (product managers, staff from business units, and clients), maintaining existing models, data collecting/cleaning, preparing for the next meeting, and the list keeps going. AutoML can be a great tool to save your time as it only costs you a few clicks and a few bucks to train a model with adequate performance. As a result, you can focus on tasks that produce the most value (sometimes spending time on preparing a fabulous presentation is worth more than improving 1% of the model’s accuracy).
Which AutoML is better? (Google Cloud AutoML vs. Azure Machine Learning)

The table above summarizes our experience of using AutoMLs on Google Cloud and Azure. Here we would like to point out some details.
- User Experience:
We encountered a few errors while using Azure. When we were training models on the ASHRAE data set (about 20 million rows, 30 columns), one-third of our experiments failed. We set the training time limit to make both platforms comparable, but it seems with an extensive data set like ASHRAE’s, a one hour limit can lead to some errors. However, when running a smaller dataset, like our Speed Dating dataset, the process was fairly efficient. On the other hand, we didn’t encounter any problem on the Google platform.
- Interpretability:
Google’s AutoML uses its proprietary deep learning algorithm. Thus, in terms of interpretability, the best Google AutoML can do is to print out the feature importance. On the other hand, in Azure, the interpretability essentially depends on what model you use. Though not all of the models in Azure are more interpretable than Google’s model, it is still more flexible. For example, if you use an XGB model tuned by Azure, you can download the model and run SHAP on it to understand how features affect the model’s output.
Some reminders before you try AutoMLs:
- When using Google’s AutoML, let the platform take care of feature selection. As shown in our experiments, selecting/deleting features before running Google’s AutoML on the data set harmed the performance. A better approach is to add whatever features that you think are appropriate to the original data set and let Google’s AutoML pick the best features.
- If you are dealing with a large data set, Google’s AutoML may be a better choice. If you have to use Azure’s platform, make sure you set a higher time limit (or set no limit at all) to prevent potential errors. On the other hand, if your data set is relatively small (less than one million rows), Azure might perform better.
- Name the columns without space. Column names with space in them can cause errors when uploading data set on both platforms, so make sure you name your columns properly! In Python, a recommended alternative to space is underscore (_).
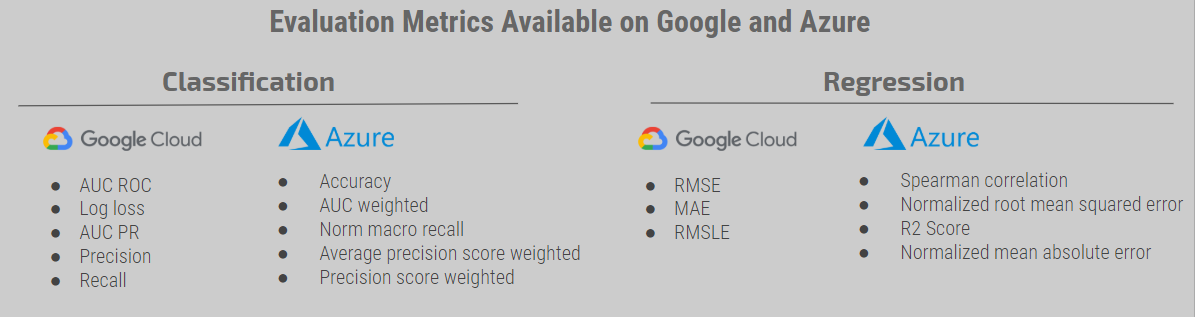
- Be familiar with evaluation metrics. Below we listed the evaluation metrics available on both platforms. Sometimes you may not find the metric you want to train the model on, so you need a proxy metric. Therefore, an understanding of the properties of each metric can be helpful for you to choose evaluation metrics as well as to choose a proper AutoML platform.
References
- SpeedDating data set
- ASHRAE data set
- TPOT
- Comparing Machine Learning as a Service: Amazon, Microsoft Azure, Google Cloud AI, IBM Watson
- Tackling High-Value Business Problems Using AutoML on Structured Data (Cloud Next ‘19)
Contributors
Joseph Chin, UT Austin MSBA ’20: joseph.chin@utexas.edu
Aifaz Gowani, UT Austin MSBA ’20: aifazg92@gmail.com
Gabriel James, UT Austin MSBA ’20: gabejames@me.com
Matthew Peng, UT Austin MSBA ’20: matthew.peng@utexas.edu
Original. Reposted with permission.
Bio: Joseph Chin is a student in the MS in Business Analytics program at UT Austin, with a undergraduate degree in Finance.
Related: