10 Python Skills for Beginners
Python is the fastest growing, most-beloved programming language. Get started with these Data Science tips.
By Nicole Janeway Bills, Data Scientist at Atlas Research

With Python’s straightforward, human-readable syntax, anyone can access impressive capabilities for scientific computing. Python has become the standard language for data science and machine learning, and it was rated in the top three most loved languages in Stack Overflow’s 2020 Developer Survey.
If you’re a newcomer to this much loved programming language, here are ten tips to promote the flourishing of your Python skillset. You can follow along in this Google Colab notebook (plus, a quick video introduction to Google Colab).
#10 — List comprehensions
A simple, single-line syntax for working with lists, a list comprehension allows you to access and perform an action on individual elements of a list.
The syntax consists of brackets containing an expression like print(plant), followed by a for and/or if clause.
will print:
boat orchid
dancing-lady orchid
nun's hood orchid
chinese ground orchid
vanilla orchid
tiger orchid
(Note: the semicolon at the end of the list comprehension will suppress printing the output of the last line of the Jupyter Notebook cell. This way, Jupyter Notebook won’t also print a list of None.)
#9 — Single-line if statement
Along with the previous tip, the single-line if can help you make your code more concise.
Let’s say we’ve decided we’re interested in identifying whether or not a plant is an orchid. With a single line-if, we start with the value we want to output if the test condition is true.
This code combines single-line if with list comprehension to output a 1 where the plant is an orchid and otherwise outputting a 0.
[1 if 'orchid' in plant else 0 for plant in greenhouse]will output:
[1, 0, 1, 1, 0, 0, 0, 1, 1, 1, 0]This list is not so interesting on its own, but when combined with the next tip, we’ll see a practical use of the single-line if.
#8 — Apply a lambda to a DataFrame column
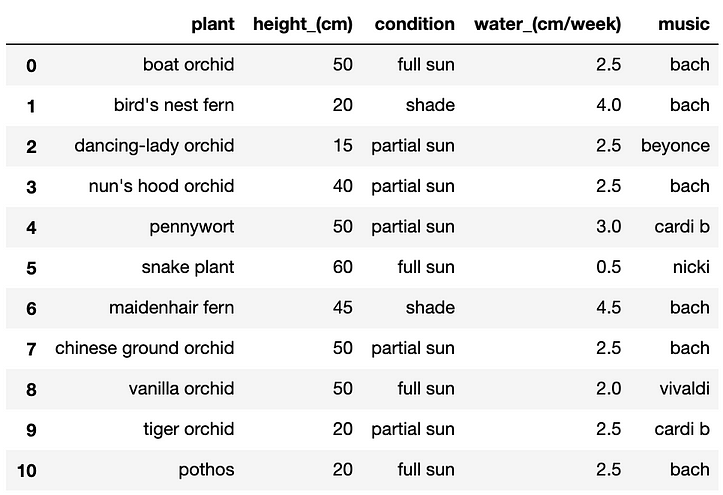
A pandas DataFrame is a structure that can hold tabular data, like Excel for Python. lambda is a keyword that provides a shortcut to performing operations on values in the table.
Let’s say we have a table of information about our greenhouse plants:
Printing this dataframe will show the following:
Let’s say we wanted to know whether a plant prefers a certain German classical composer.
data[‘music’].apply(lambda x: 1 if x == ‘bach’ else 0)will output:
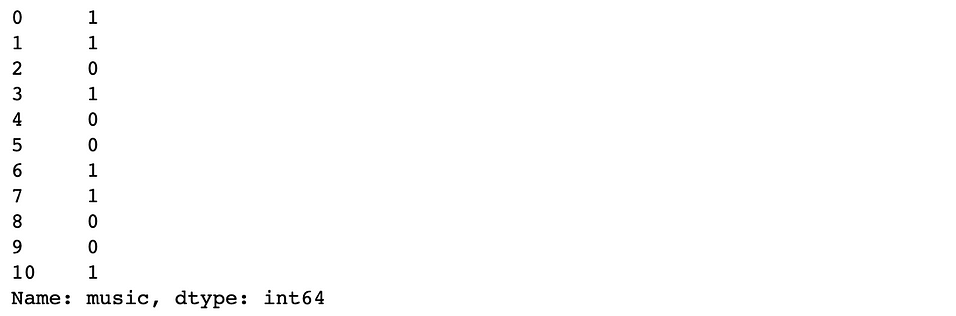
where the first column is the DataFrame index and the second column is a series representing the output of the single-line if.
lambda represents an “anonymous function.” It allows us to perform operations on the values in a DataFrame without creating a formal function — i.e., a function with def and return statements, which we’ll see in a moment.
#7— Apply a condition to multiple columns
Let’s say we want to identify which Bach-loving plants also need full sun, so we can arrange them together in the greenhouse.
First, we create a function by using the def keyword and giving it a name with underscores between words (e.g. sunny_shelf). Appropriately, this naming convention is called snake case ????
The function sunny_shelf takes in two parameters as its inputs — the column to check for “full sun” and the column to check for “bach.” The function outputs whether both these conditions are true.
On line 4, we .apply() this function to the DataFrame and specify which columns should be passed in as parameters. axis=1 tells pandas that it should evaluate the function across columns (versus axis=0, which evaluates across rows). We assign the output of the .apply() function to a new DataFrame column called ‘new_shelf.’
Alternatively, we could use the np.where() function for the same purpose:
This function from the numpy library checks the two conditions specified above (i.e., that the plant is a lover of full sun and Germanic classical music) and assigns the output to ‘new_shelf’ column.
For these tips on .apply(), np.where(), and other incredibly useful code snippets, check out Chris Albon’s blog.
#6— Break up a long line of code
By the way, you can break up any statement inside parentheses, brackets, or braces across multiple lines to avoid a single line from running too long. We’ve seen this when we initialized our greenhouse list, created our dataframe of plants, and used the np.where() function.
According to PEP8, the Python style guide:
The preferred way of wrapping long lines is by using Python’s implied line continuation inside parentheses, brackets, and braces.
#5 — Read in a .csv and set index
Now let’s expand our greenhouse, so we have more real world data to work with. We’ll do this by importing a .csv containing plant data. Follow along by accessing the dataset here.
Let’s say the table contains a unique plant identifier that we want to use as an index in our DataFrame. We can set this up with the index_col parameter.
data = pd.read_csv('greenhouse.csv', index_col='plant_id')
For the fundamentals of exploratory data analysis (EDA) and 9 other useful Python tips, check out this article:
10 Underrated Python Skills
Up your Data Science game with these tips for improving your Python coding for better EDA, target analysis, feature…
#4— Format as money
How much are we spending on these plants anyway? Let’s format the output of this calculation as money.
‘${:,.2f}’.format(data[‘price’].sum())will output:
'$15,883.66'The comma separator makes it easy to see how much cash we’ve dropped so far.
#3 — Create a pivot table
Next, let’s say we want to see the amount spent per plant species. We can pivot with aggregation using either pd.pivot_table() or .groupby().
pd.pivot_table(data, index=’plant’, values=’price’, aggfunc=np.sum)or
data[[‘plant’,’price’]].groupby(by=’plant’).sum()Either method will output the following:

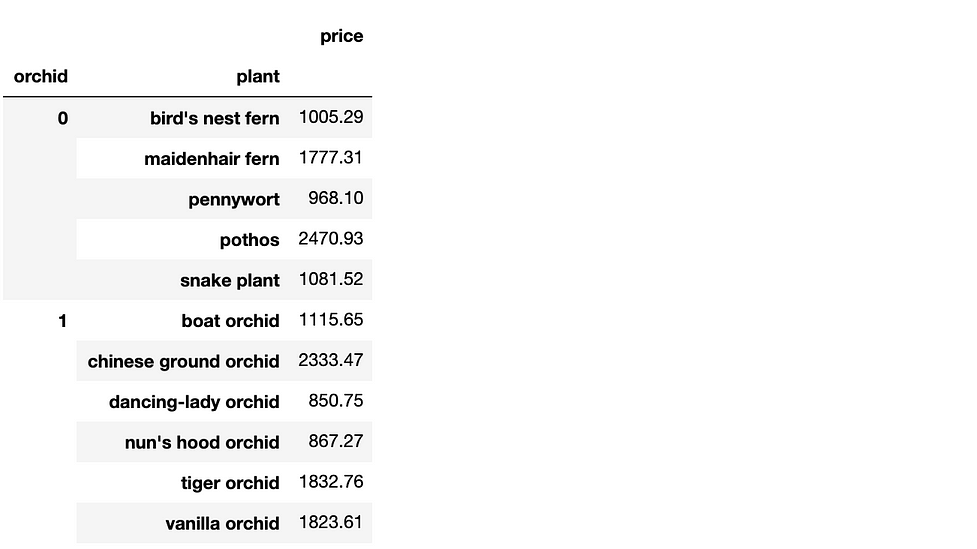
We can also specify a multilevel pivot table using either method.
Checking piv.equals(piv0) yields True.
Here’s what the resulting DataFrame looks like:
#2— Calculate percent of total
Curious about how each plant species contributed toward the total cost of the greenhouse? Divide each value by the sum across all the rows, and assign that output to a new column called ‘perc’:
piv['perc'] = piv['price'].div(piv['price'].sum(axis=0))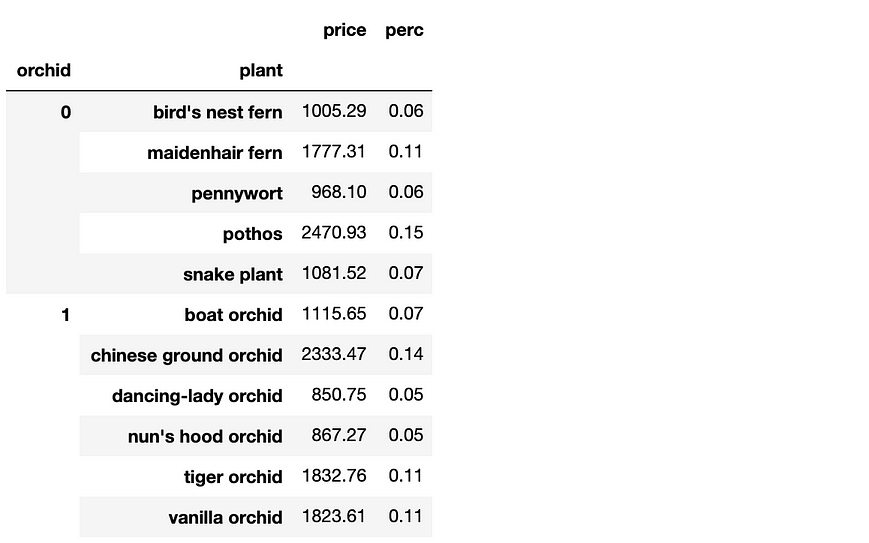
#1 — Sort by multiple columns
Finally, let’s sort our DataFrame so that orchids are at the top and the plants are organized by price descending.
piv.sort_values([‘orchid’,’price’], ascending=False)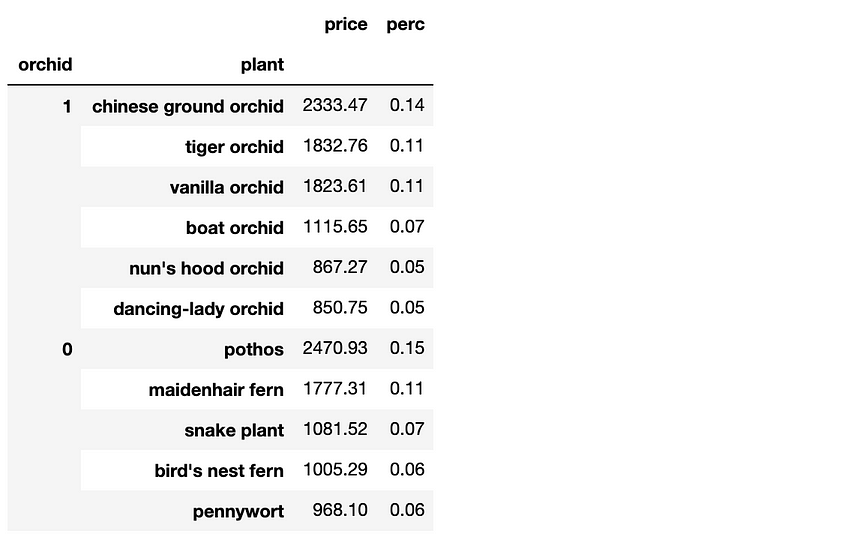
Summary
In this article, we covered 10 Python skills that might be useful for beginner Data Scientists. These tips include:
- List comprehensions (#10)
- Single-line if statement (#9)
- Apply a lambda to a DataFrame column (#8)
- Apply a condition to multiple columns (#7)
- Break up a long line of code (#6)
- Read in a .csv and set index (#5)
- Format as money (#4)
- Create a pivot table (#3)
- Calculate percent of total (#2)
- Sort by multiple columns (#1)
Access the Colab notebook here, and access the greenhouse dataset here.
I hope this write up helps you grow your skillset as a new Data Scientist. Thanks for letting me share two of my favorite things — Python and gardening — in one article.
If you enjoyed this story, check out 10 Undervalued Python Skills and 10 Python Skill They Don’t Teach in Bootcamp. Follow me on Medium, LinkedIn, YouTube, and Twitter for more ideas to advance your data science skills.
More Great Resources for Data Scientists
The Best Data Science Certification You’ve Never Heard Of
A practical guide to the most valuable training in data strategy.
5 Must-Read Data Science Papers (and How to Use Them)
Foundational ideas to keep you on top of the data science game.
What’s the Difference Between a Data Analyst, Data Scientist, and a Machine Learning Engineer?
Explore the distinction between these common job titles with the analogy of a track meet.
How to Future-Proof Your Data Science Project
5 critical elements of ML model selection & deployment
Is Your Machine Learning Model Likely to Fail?
5 missteps to avoid in your planning process
Bio: Nicole Janeway Bills is a machine learning engineer with experience in commercial and federal consulting. Proficient in Python, SQL, and Tableau, Nicole has business experience in natural language processing (NLP), cloud computing, statistical testing, pricing analysis, and ETL processes, and aims to use this background to connect data with business outcomes and continue to develop technical skillsets.
Original. Reposted with permission.
Related:
- 10 Underrated Python Skills
- 6 Lessons Learned in 6 Months as a Data Scientist
- fastcore: An Underrated Python Library