Multidimensional multi-sensor time-series data analysis framework
This blog post provides an overview of the package “msda” useful for time-series sensor data analysis. A quick introduction about time-series data is also provided.
By Ajay Arunachalam, Orebro University
Hello, friends. In this blog post, I will take you through my package “msda” useful for time-series sensor data analysis. A quick introduction about time-series data is also provided. The demo notebook can be found on here
One of the specific use case applications focused on “Unsupervised Feature Selection” using the package can be found in the blog post here.
What is Time Series Data?
Time series data is information taken at a particular duration. For instance, having a set of sensor data observed at particular equal paces, each sensor can be classified as time series. If the data is collected without any order in time, or at once, it is not time series data.
There are two types of time series data:
1- Stock Series (Measure of attribute, in particular point of time)
2- Flow Series (Measure of activity, in a time interval)
Components of Time Series Data
To analyze time series data, we need to know the different pattern types. These patterns will together create the set of observations on time series.
1) Trend: A long pattern present in the time series. It represents the variations of low, medium and high frequency filtered out from the time series.
If there is no increasing or decreasing pattern in the time series data, it is taken as stationary in the mean.
There are two types of trend pattern:
- Deterministic: In this case, the effects of shocks present in the time series are eliminated.
- Stochastic: It is the process in which the effects of shocks are never eliminated as they have permanently changed the level of the time series.
2) Cyclic: The pattern exhibit up and down movements around a specified trend. The period of time is not fixed and usually composed of at least 2 months in duration.
3) Seasonal: Pattern that reflects regular fluctuations. These short-term movements occur due to the seasonal and custom factors of people. The data faces regular and predictable changes which occurs on regular intervals of calendar. It always consist of fixed and known period.
The main sources of seasonality:
- Climate
- Institutions
- Social habits and practices
- Calendar etc.
Models to create a seasonal component in time series:
- Additive Model — It is the model in which the seasonal component is added with the trend component.
- Multiplicative Model — In this model seasonal component is multiplied with the intercept if trend component is not present in the time series.
4) Irregular: It is an unpredictable component of time series.
Time Series Data vs Cross-Section Data
Time Series Data is composed of collection of data of one specific variable at particular interval of time. On the other hand, Cross-Section Data is consist of collection of data on multiple variables from different sources at a particular interval of time. Collection of company’s stock market data at regular interval of year is an example of time series data. But when the collection of company’s sales revenue, sales volume is collected for the past 3 months then it is taken as an example of cross-section data. Time series data is mainly used for obtaining results over an extended period of time, but cross-section data focuses on the information received from surveys at a particular time.
What is Time Series Analysis?
Analysis is performed in order to understand the structure and functions produced by the time series.
Two approaches are used for analyzing time series data are -
- In the time domain
- In the frequency domain
Time series analysis is mainly used for -
- Decomposing the time series
- Identifying and modeling the time-based dependencies
- Forecasting
- Identifying and model the system variation
Need of Time Series Analysis
In order to model successfully, the time series is important in machine learning and deep learning. Time series analysis is used to understand the internal structure and functions that are used for producing the observations. Time Series analysis is used for -
- Descriptive — Patterns are identified in correlated data. In other words, the variations in trends and seasonality in the time series are identified.
- Explanation — Understanding and modeling of data is performed.
- Forecasting — The prediction from previous observations are performed for short term trends.
- Invention Analysis — Effect performed by any event in time series data, is analyzed.
- Quality Control — When the specific size deviates, it provides an alert.
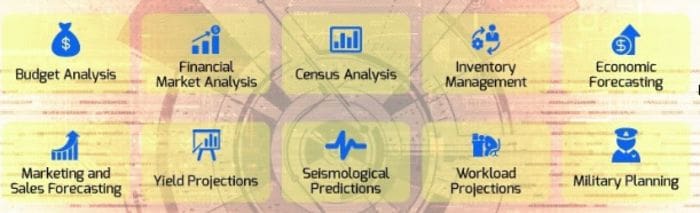
Applications of Time Series Analysis
Now, that we have seen through the basics of time-series, let’s dwell into the MSDA package & its details.
What is MDSA?
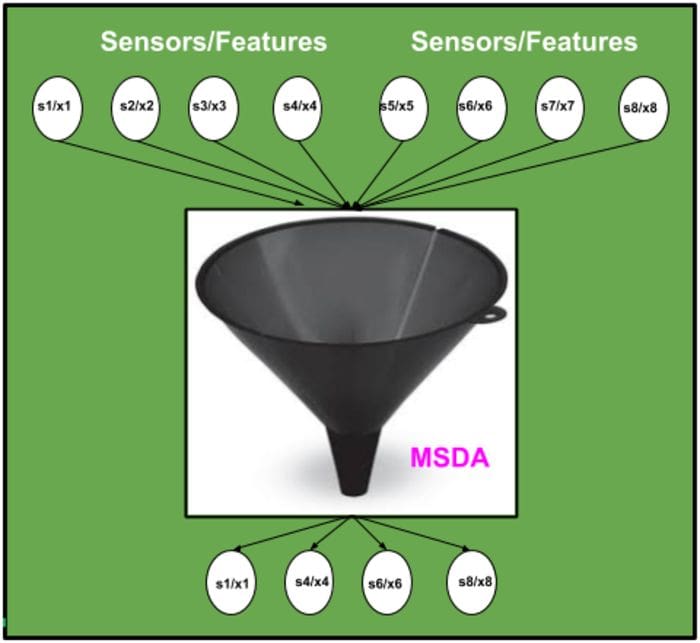
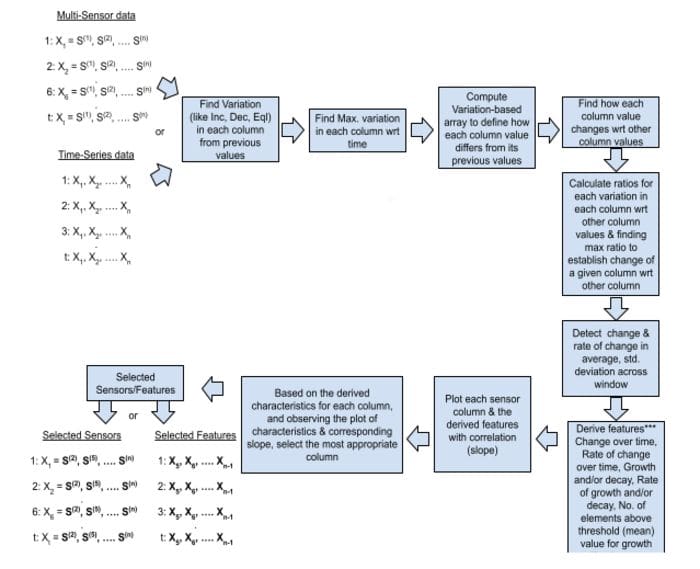
MSDA is an open source low-code Multi-Sensor Data Analysis library in Python that aims to reduce the hypothesis to insights cycle time in a time-series multi-sensor data analysis & experiments. It enables users to perform end-to-end proof-of-concept experiments quickly and efficiently. The module identifies events in the multidimensional time series by capturing the variation and trend to establish relationships aimed towards identifying the correlated features helping in feature selection from raw sensor signals.
The package includes:-
- Time series analysis.
- The variation of each sensor column wrt time (increasing, decreasing, equal).
- How each column values varies wrt other column, and the maximum variation ratio between each column wrt other column.
- Relationship establishment with trend array to identify most appropriate sensor.
- User can select window length and then check average value and standard deviation across each window for each sensor column.
- It provides count of growth/decay value for each sensor column values above or below a threshold value.
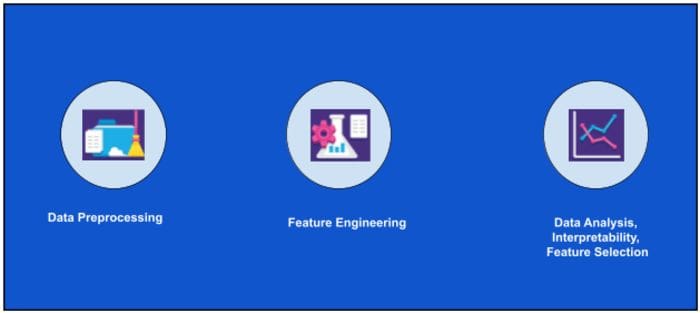
- Feature Engineering
a) Features involving trend of values across various aggregation windows: change and rate of change in average, std. deviation across window.
b) Ratio of changes, growth rate with std. deviation.
c) Change over time.
d) Rate of change over time.
e) Growth or decay.
f) Rate of growth or decay.
g) Count of values above or below a threshold value.
Overview:-
Prototype for feature/sensor selection from multi-dimensional heterogeneous/homogeneous time series multi-sensor data. The intuitive representation of the framework is as shown below.
Features Include:-
MSDA Workflow:-
Terminal Installation:-
The easiest way to install msda is using pip.
pip install msda
or
$ git clone https://github.com/ajayarunachalam/msda
$ cd msda
$ python setup.py install
Install in Jupyter Notebook:-
!pip install msda
Follow the rest as demonstrated in the demo example [here] — https://github.com/ajayarunachalam/msda/tree/master/demo.ipynb
Who should use MSDA?
MSDA is an open source library that anybody can use. In my view, the ideal target audience of MSDA is:
- Students.
- Researchers for quick poc testing.
- Experienced Data Scientists who want to increase productivity.
- Citizen Data Scientists who prefer a low code solution.
- Data Science Professionals and Consultants involved in building Proof of Concept projects.
Contact
You can reach me at ajay.arunachalam08@gmail.com
Thank you for reading. Happy Learning :)
References
Time series
A time series is a series of data points indexed (or listed or graphed) in time order. Most commonly, a time series is…
Introduction to Time Series Analysis
Hi folks,Thanks a lot for reading my blog posts and motivating me for writing.You can read all my blogs Here.
Bio: Ajay Arunachalam (personal website) is a Postdoctoral Researcher (Artificial Intelligence) at Centre for Applied Autonomous Sensor Systems, Orebro University, Sweden. Prior to this, he was working as a Data Scientist at True Corporation, a Communications Conglomerate, working with Petabytes of data, building & deploying deep models in production. He truly believes that Opacity in AI systems is need of the hour, before we fully accept the power of AI. With this in mind, he has always strived to democratize AI, and be more inclined towards building Interpretable Models. His interest is in Applied Artificial Intelligence, Machine Learning, Deep Learning, Deep RL, and Natural Language Processing, specifically learning good representations. From his experience working on real-world problems, he fully acknowledges that finding good representations is the key in designing the system that can solve interesting challenging real-world problems, that go beyond human-level intelligence, and ultimately explain complicated data for us that we don't understand. In order to achieve this, he envisions learning algorithms that can learn feature representations from both unlabelled and labelled data, be guided with and/or without human interaction, and that are on different levels of abstractions in order to bridge the gap between low-level data and high-level abstract concepts.
Original. Reposted with permission.
Related:
- Building AI Models for High-Frequency Streaming Data
- Simple & Intuitive Ensemble Learning in R
- Simple Python Package for Comparing, Plotting & Evaluating Regression Models