Create and Deploy Dashboards using Voila and Saturn Cloud
Working with and training large datasets, maintaining them all in one place, and deploying them to production is a challenging job. In this article, we covered what Saturn Cloud is and how it can speed up your end-to-end pipeline, how to create dashboards using Voila and Python and publish them to production in just a few easy steps.
By Dhrumil Patel, Performance Analyst Intern at NVIDIA
Filter and Visualize Bank Transactions Data
Working with and training large datasets, maintaining them all in one place, and deploying them to production is a challenging job. But what if I tell you there is a way to handle all of these with just a few clicks?
Let’s understand how we can do that easily. Throughout this article we will create a dashboard (using Python and Voila) which runs a machine learning model to remove fraudulent transactions and displays remaining data with visualization, and publish it to Saturn Cloud’s production server for easier access. Here is an outline of the article, feel free to jump a section or two if you are aware of the details.
- What is Saturn Cloud?
- Create the Dashboard ( With Data Filtering and Visualization)
- Deploy Dashboard (Local and Production)
- End-notes
What is Saturn Cloud
Saturn cloud is a machine learning platform that automates DevOps and ML infrastructure. On top of that, they use jupyter and dash to scale python for enormous amounts of data. Here are a few more features Saturn Cloud offers:
- You can use Dask to run your code in parallel over as many machines as you need
- You can run your code on GPU without any hassle
- You can deploy your work without relying on a separate team
- It is built entirely on open source tools
- It can also run in your AWS account. Also, Saturn Cloud connects to your existing data, you don’t have to move it. Add the required credentials and you’re good to go.
- You can connect to Dask from Google Colab. You could also connect to any GCP service that can host Python.
Isn’t that cool? Let’s learn how we can create a dashboard and publish it to production using Saturn in a few easy steps.
Creating a Dashboard
Voila 101
Before deploying the dashboard, first, let us create a basic dashboard using Python and Voila. There are three major components to creating dashboards using Voila, which are:
- Define widgets (Button click or search field for interaction)
- A logic (event handler) for your for the interactive field we created in step 1(either class based or function based)
- An Output widget (where your result would show up)
Taking fake transactions data, let’s build a dashboard which gives you filtered data after removing fraudulent transactions and gives a visual of how diverse (with respect to currencies) the transactions are. Let’s presume that you have a machine learning model that identifies fraudulent transactions. For the simplicity of this article we will simply use an if statement, but don’t worry, I’ll show you how to import your own model, if you have one.
A Basic Dashboard
First things first, you want to define a widget. For our use-case, we want users to upload data and give them filtered data and a chart after removing fraudulent transactions. We will start by defining the upload button.
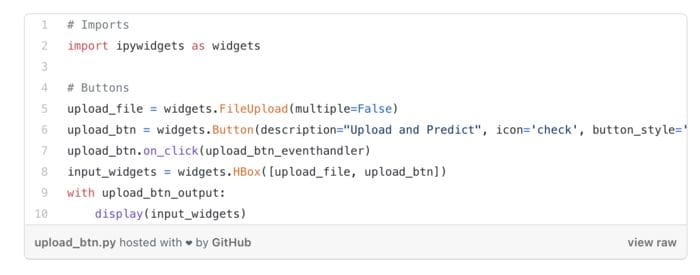
Here we have two buttons — One for uploading file (upload_file) and another (upload_btn) to let our event handler (upload_btn_eventhandler) to know when to perform action. I know, you must be wondering but where is our event handler? We will define it next. But before that, input_widgets just combine both buttons and with help of our output widget (upload_btn_output) we will display the buttons. Let’s write an event handler first.
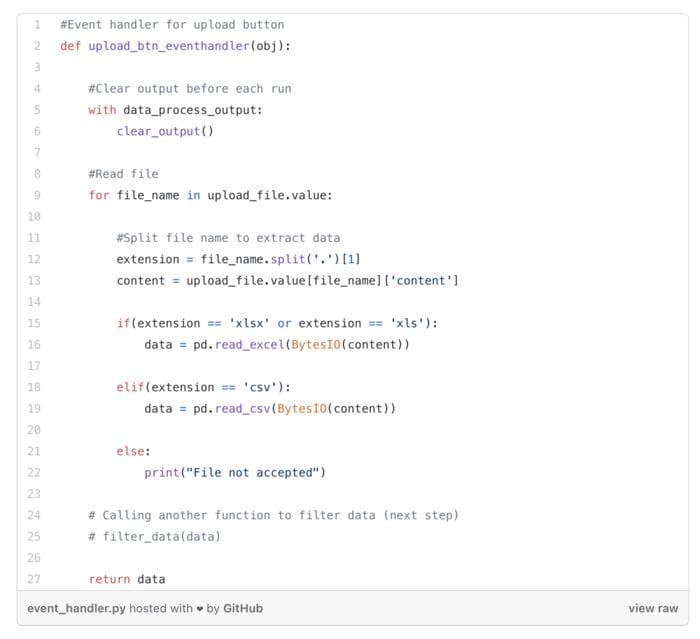
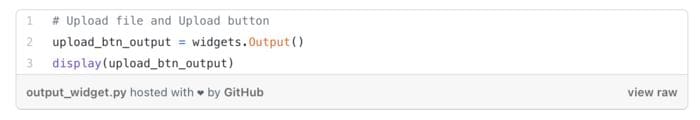
As soon as we hit the upload button, our event handler will take the file and convert it to a pandas dataframe to work on data easily. I split the file name by fullstop to find the extension of the file and then store the data if it is Excel or CSV. Now the final part, output widget. If you remember, we already wrote out an output widget to be named upload_btn_output, so we will do just that.
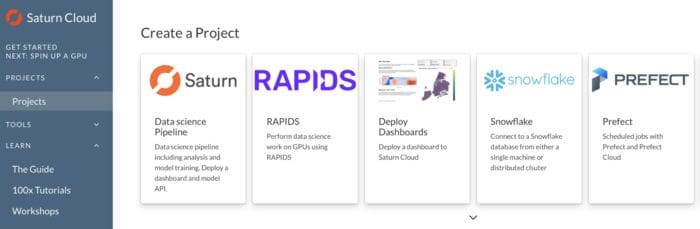
Now if you haven’t already, you have to install voila if you want this to run locally, for which you can find instructions here. But I am going to show you an easy way to do it using Saturn Cloud. Create an account and login, on their dashboard, you will see “deploy dashboards”, click that, and start the jupyter lab. Now, upload the notebook that we just created to the jupyter lab on saturn cloud. You can find the entire jupyter notebook on my github here. Also, you can choose from other accelerated data science libraries and pipelines that Saturn Cloud has to offer.
Done? Perfect. Now copy the URL, paste into the new tab, and replace …./your-username/dashboard/…. with /your-username/dashboard/voila and then navigate to projects>examples>dashboard.ipynb and run it. You should be able to see our upload buttons.
If you hit any bumps, or want to learn more about creating a dashboard with Voila on Saturn Cloud, refer to this guide.

Fraudulent Transactions
Now we don’t have any filtered data just yet, we are just uploading a file and storing its content. Let’s write some more code to handle fraudulent transactions.
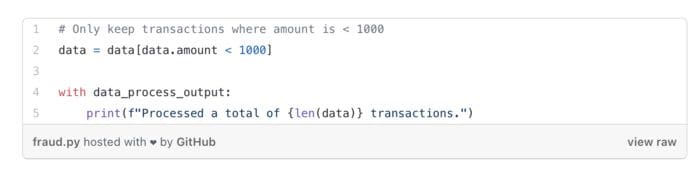
I have generated a csv from fake data which you can find here, feel free to use the same. Here, I’ll just remove the values considering them fraudulent if they exceed a certain threshold. Let’s say all transactions with an amount > 1000 are fraud. Simply we can achieve that by writing the following in our upload_btn_eventhandler.
If you have your data on a cloud such as AWS, that’s no worry at all. All you need to do is acquire your credentials and you are good to go. One way you can do that easily is by using s3fs library which is a Python library for accessing your AWS file system. You can read more about that in the documentation here.
Using Pre-trained model (extra)
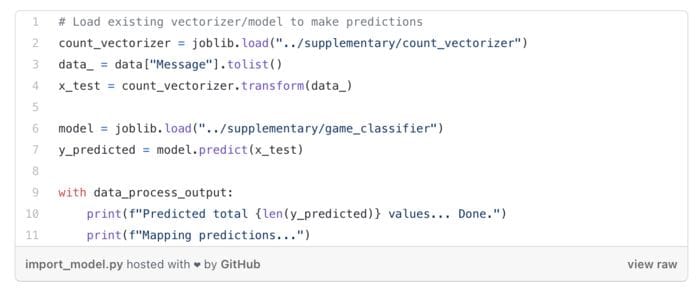
If you have a pre-trained model that you want to use, you can import it like I did below, but if you just want to know how things work around voila and are not interested in importing machine learning models, you can skip the next code. We are basically using joblib to load count vectorizer and model and then predicting the values.
Filter Data
Awesome, now we have clean data without fraudulent transactions. How about we add a little functionality to filter transactions based on the currency? We can achieve that by simply creating another logic just like we created for the upload button. Instead of taking data from the user, now we just pass the clean dataframe that we created. Let’s take a look at the code:
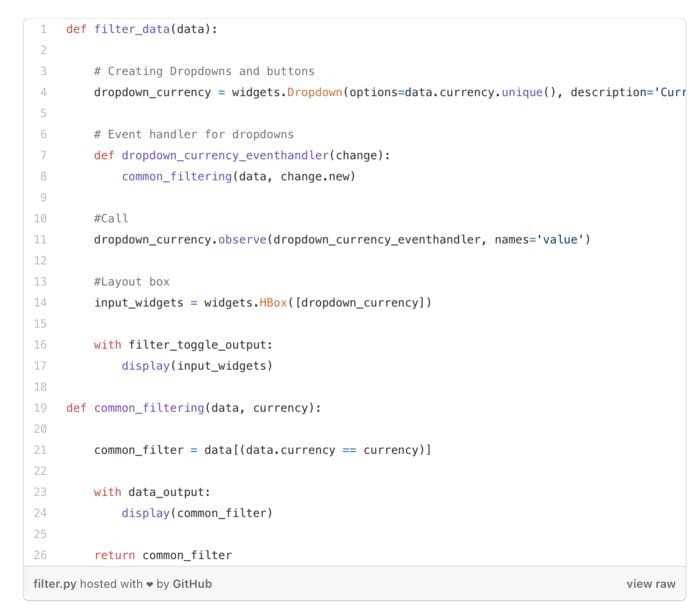
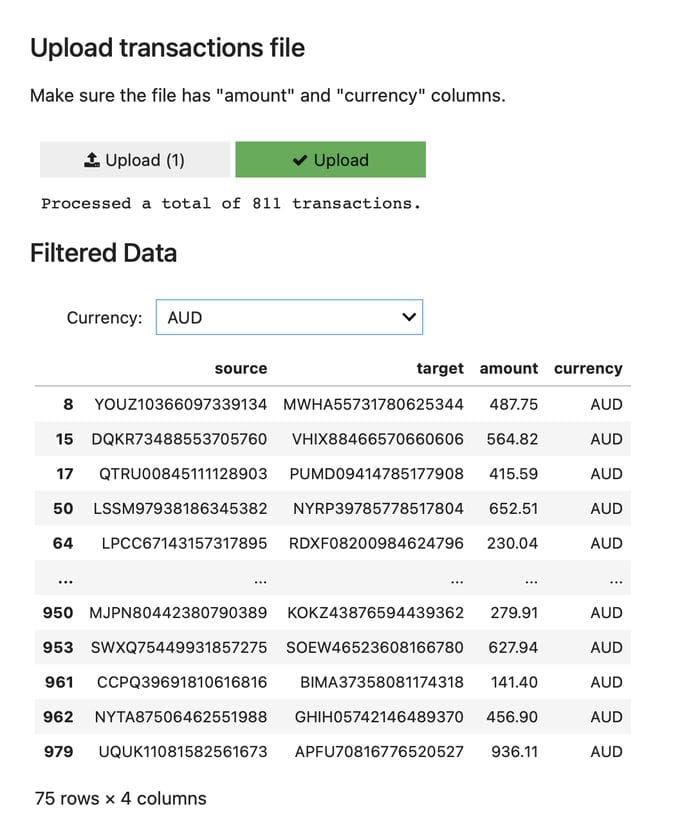
We will follow the same pattern here as well. First, we create a dropdown for all unique values in the currency column. Then we create an event handler which will call another function common_filtering which will basically match the currency and give us only those values where our currency matches, in other words, filtering. And we then display it to an output widget that we just created. If you are using the same data file I added, it should look something like this.
Visualization
Let’s move on to visualize the filtered data that we have. We will make a line chart for the count of currencies in our data to see how transactions took place over several of them.
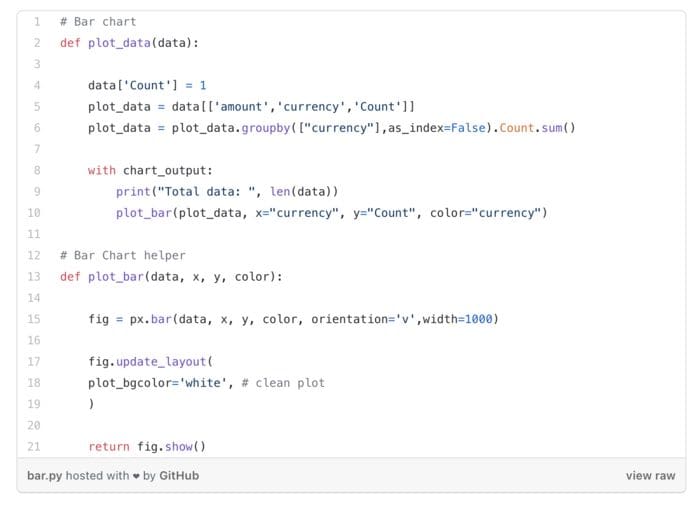
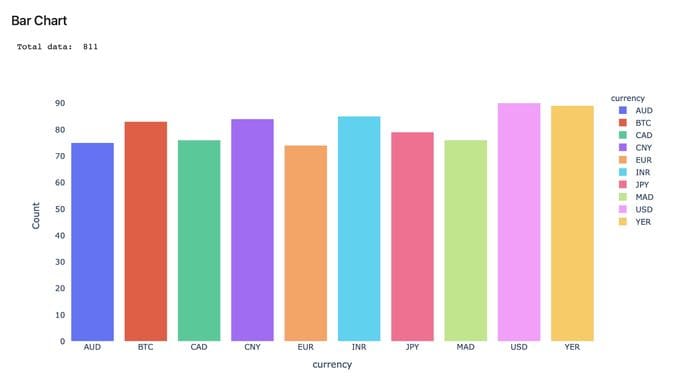
First, we create a new column count and we count the occurrence of each currency. And we pass that as our plot_data where on the X-axis we keep currency and on Y-axis we keep the count. We are using plotly here — import plotly as px — and keeping a separate helper function that we call for the plot. You can see the bar chart like this on the dashboard if everything runs successfully.
And voila (pun intended), you have a working dashboard. Now we can publish it to production using Saturn Cloud and it is as easy as clicking a few clicks.
Publish to Production
To create a deployment, go to a project page and click the “Create a deployment button”
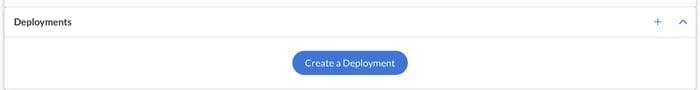
Create Deployment
You will be prompted with the configuration page. As you can see below, you only have to set a name and command, and you will be ready to go. However; there are plenty of options to explore on Saturn Cloud, which you can find here.
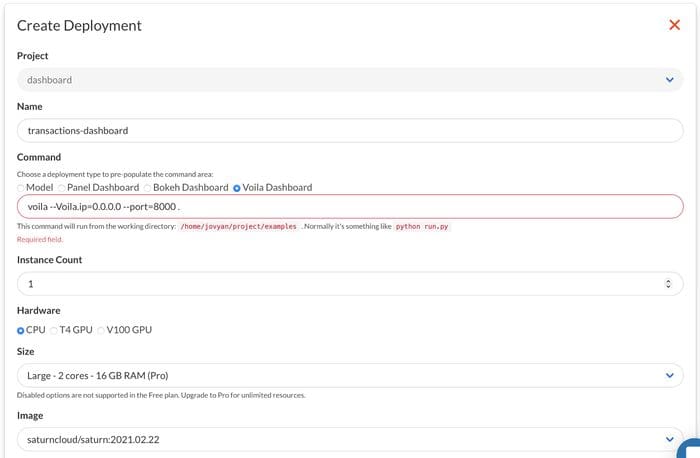
Configuration
Now that configuration is ready, you will be able to see the dashboard, hit the little play button next to the URL and as soon as it is active, visit the URL to access your dashboard.
Endnotes
In this article, we covered what Saturn Cloud is and how it can speed up your end-to-end pipeline, how to create dashboards using Voila and Python and publish to production using Saturn Cloud in just a few easy steps. Having the right tools helps you a lot and Saturn Cloud is one of them if you are into accelerating your processing or data science pipeline. If you have any questions, feel free to reach out to me via twitter or Linkedin, or just drop by to say hello.
Bio: Dhrumil Patel (@Dhrumilcse) is a Performance Analyst Intern at NVIDIA. His interest lies in working with data on a large scale and web application development using modern frameworks such as Django. He also posses hands-on exposure to NLP while handling enormous social media data. Apart from work, he enjoys reading books and doing origami.
Related:
- Super Charge Python with Pandas on GPUs Using Saturn Cloud
- Data Scientists, You Need to Know How to Code
- When good data analyses fail to deliver the results you expect