What is Clustering and How Does it Work?
Let us examine how clusters with different properties are produced by different clustering algorithms. In particular, we give an overview of three clustering methods: k-Means clustering, hierarchical clustering, and DBSCAN.
By Satoru Hayasaka, Data Scientist at KNIME
What is clustering?
Let's get straight into it and take a look at this scatter plot to explain. As you may notice, data points seem to concentrate into distinct groups (Figure 1).
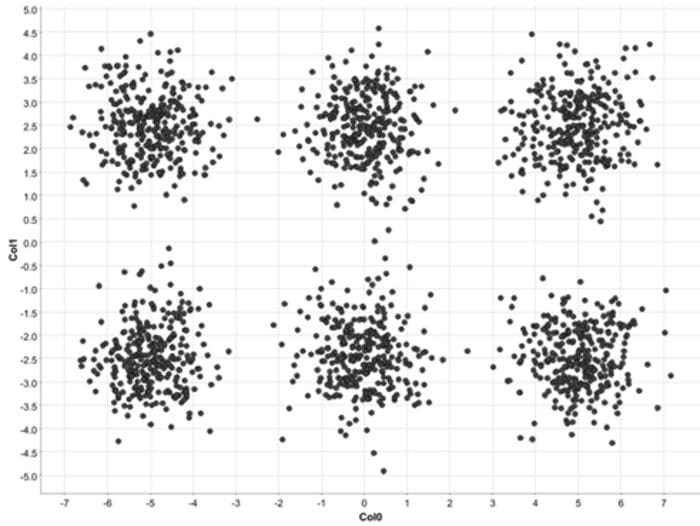
Fig. 1. A scatter plot of the example data
To make this obvious, we show the same data but now data points are colored (Figure 2). These points concentrate in different groups, or clusters, because their coordinates are close to each other. In this example, spatial coordinates represent two numerical features, and their spatial proximity can be interpreted as how similar they are in terms of their features. Realistically speaking, we may have many features in our dataset, but the idea of closeness (=similarity) still applies even in a higher dimensional space. Moreover, it is not unusual to observe clusters in real data, representing different groups of data points with similar characteristics.
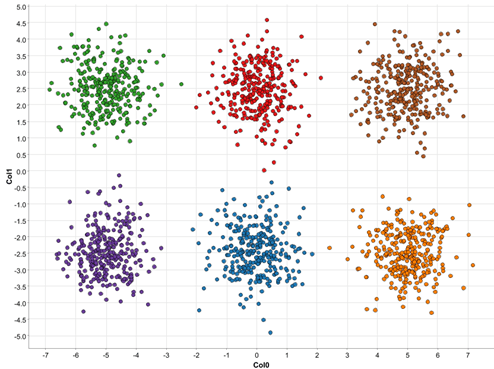
Fig. 2. A scatter plot of the example data, with different clusters denoted by different colors
Clustering refers to algorithms to uncover such clusters in unlabeled data. Data points belonging to the same cluster exhibit similar features, whereas data points from different clusters are dissimilar to each other. The identification of such clusters leads to segmentation of data points into a number of distinct groups. Since groups are identified from the data itself, as opposed to known target classes, clustering is considered as unsupervised learning.
As you have seen already, clustering can identify (previously unknown) groups in the data. Relatively homogenous data points belonging to the same cluster can be summarized by a single cluster representative, and this enables data reduction. Clustering can also be used to identify unusual observations distinct from other clusters, such as outliers and noises.
Clusters formed by different clustering methods may have different characteristics (Figure 3). Clusters may have different shapes, sizes, and densities. Clusters may form a hierarchy (e.g., Cluster C is formed by merging Clusters A & B). Clusters may be disjoint, touching, or overlapping. Now let us examine how clusters with different properties are produced by different clustering algorithms. In particular, we give an overview of three clustering methods: k-Means clustering, hierarchical clustering, and DBSCAN.
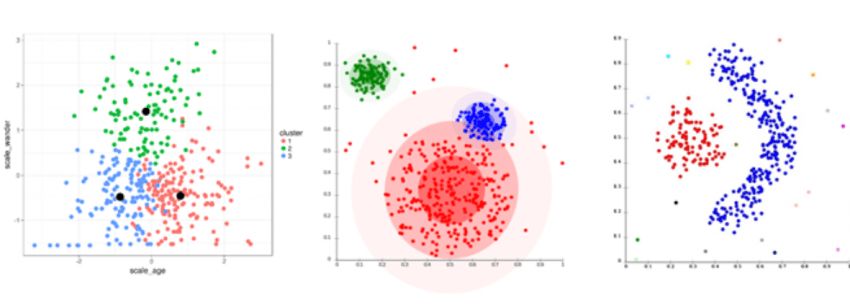
Fig. 3. Clusters with different characteristics.
How Does Clustering Work?
k-Means Clustering
k-Means clustering is perhaps the most popular clustering algorithm. It is a partitioning method dividing the data space into K distinct clusters. It starts out with randomly-selected K cluster centers (Figure 4, left), and all data points are assigned to the nearest cluster centers (Figure 4, right). Then the cluster centers are re-calculated as the centroids of the newly formed clusters. The data points are re-assigned to the nearest cluster centers we just re-calculated. This process, assigning data points to the cluster centers and re-calculating the cluster centers, is repeated until the cluster centers stop moving (Figure 5).
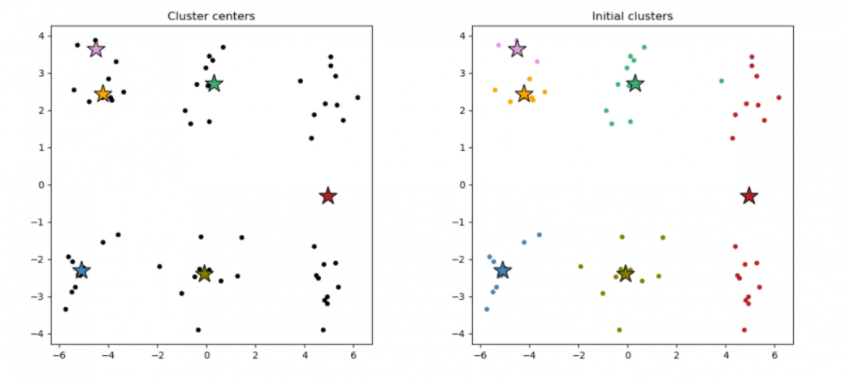
Fig. 4. Randomly selected K cluster centers (left) and resulting clusters (right).
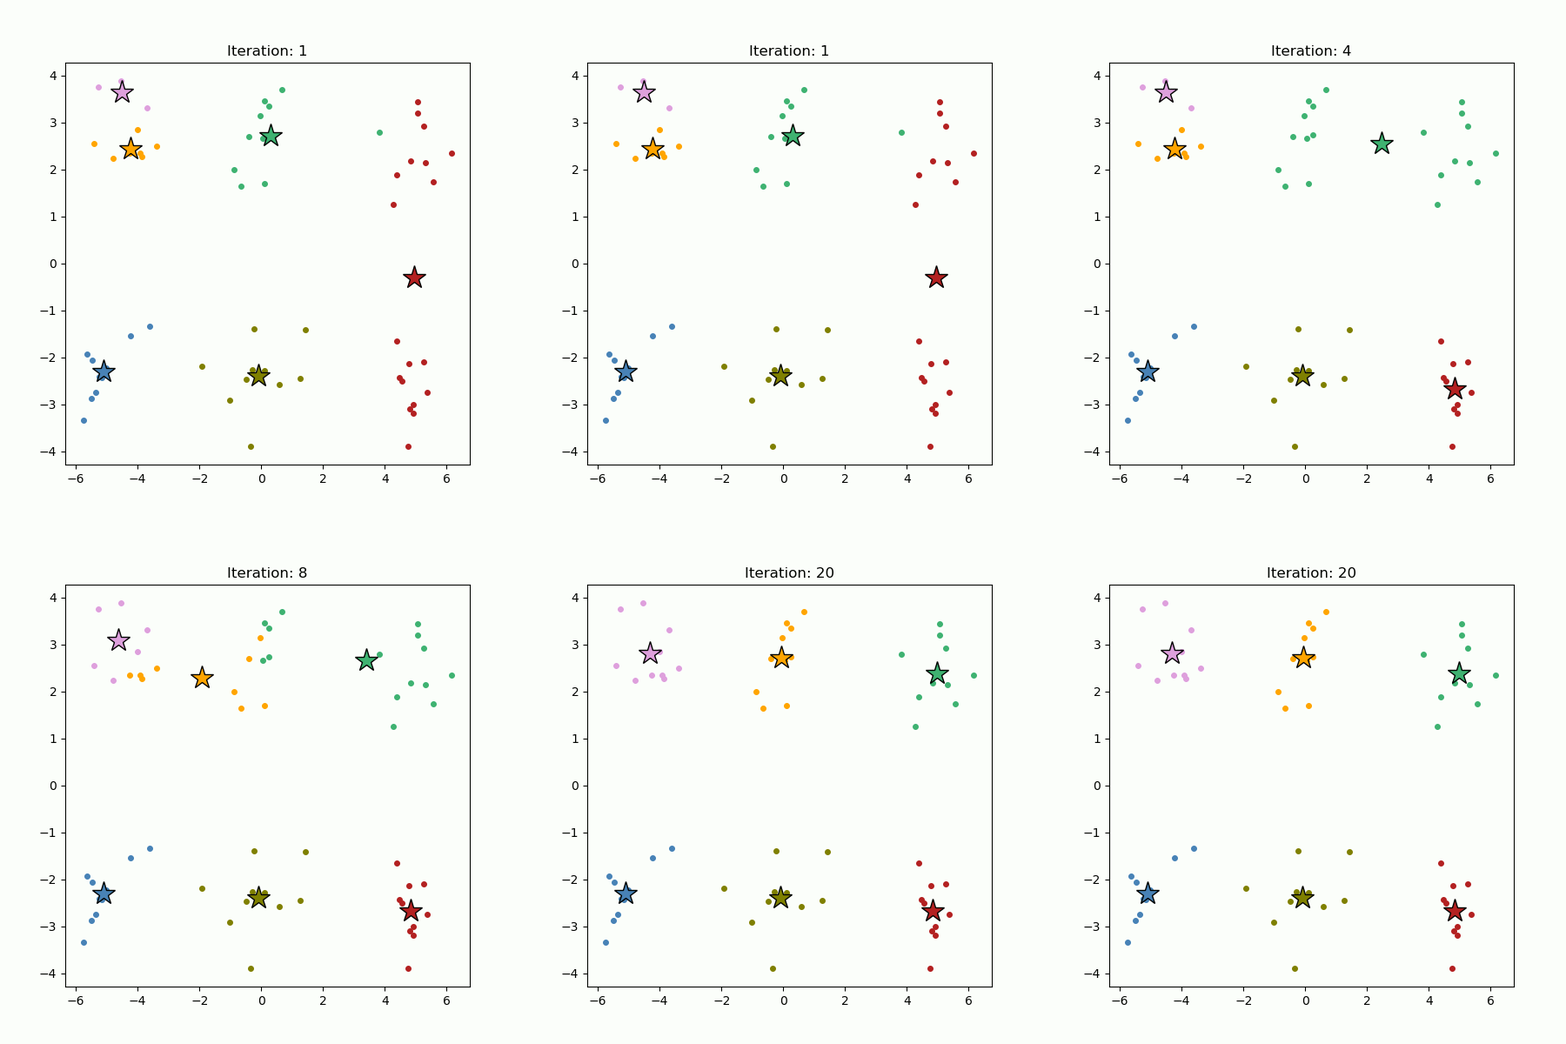
Fig. 5. Cluster centers are iteratively re-calculated until they stop moving (gif).
Clusters formed by k-Means clustering tend to be similar in sizes. Moreover, clusters are convex-shaped. k-Means clustering is known for its sensitivity to outliers. Also clustering results may be highly influenced by the choice of the initial cluster centers.
Hierarchical Clustering
Hierarchical clustering algorithm works by iteratively connecting closest data points to form clusters. Initially all data points are disconnected from each other; each data point is treated as its own cluster. Then, the two closest data points are connected, forming a cluster. Next, the two next closest data points (or clusters) are connected to form a larger cluster. And so on. The process is repeated to form progressively larger clusters, and continues until all data points are connected into a single cluster (Figure 6).
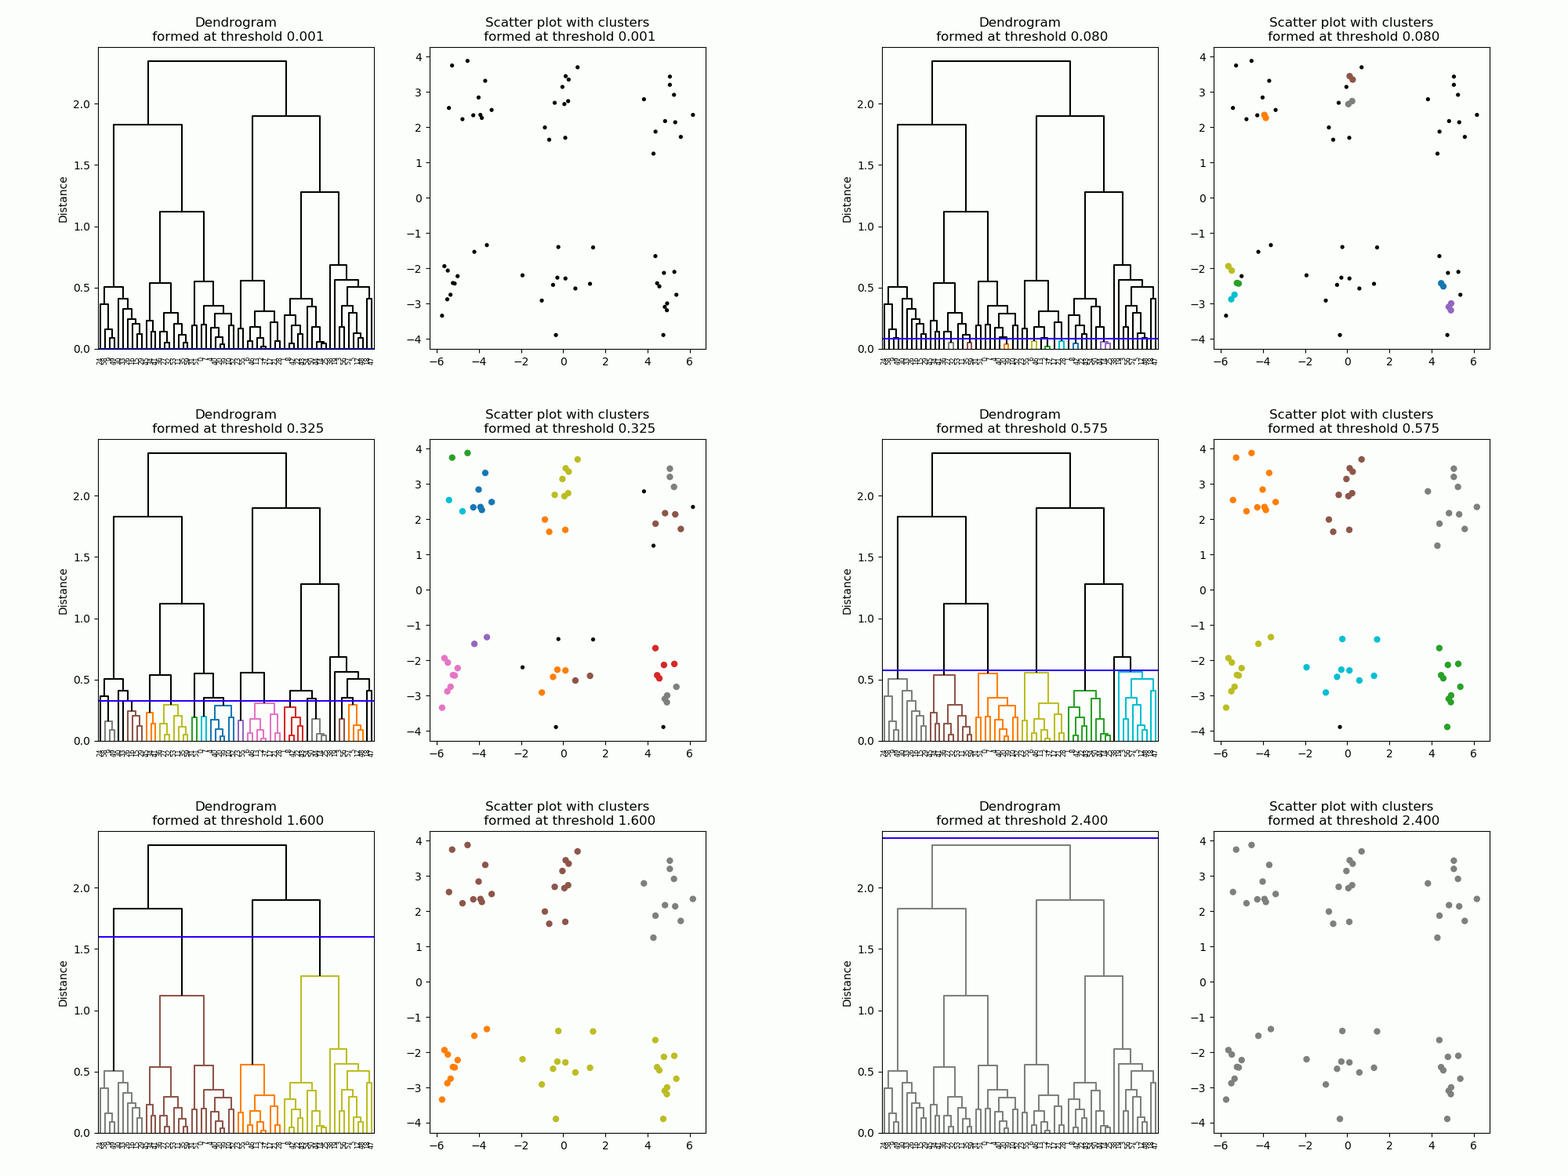
Fig. 6. A dendrogram (left) resulting from hierarchical clustering. As the distance cut-off is raised, larger clusters are formed. Clusters are denoted in different colors in the scatter plot (right), as well as the dendrogram.
Hierarchical clustering forms a hierarchy of clusters, described in a diagram known as a dendrogram (Figure 6, left). A dendrogram describes which data points / clusters are connected at what distance, starting from individual data points at the bottom all the way to the one single large cluster at the top. To obtain a cluster partition with a particular number of clusters, one can simply apply a cut-off threshold at a particular distance on the dendrogram, producing the desired number of clusters (Figure 7).
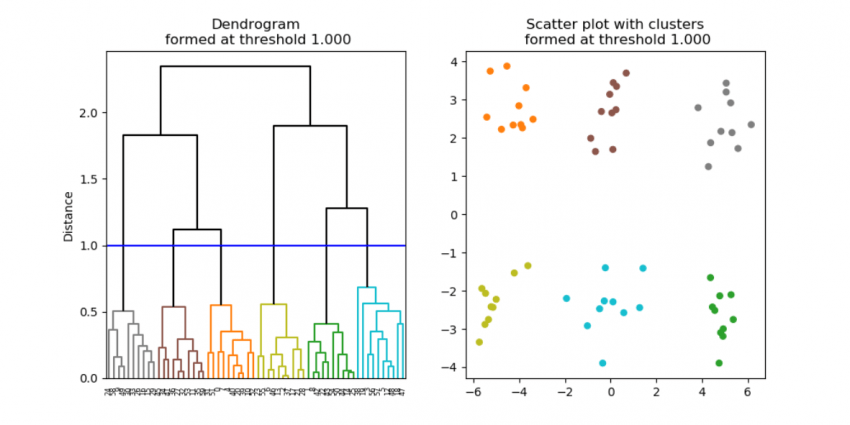
Fig. 7. Six clusters are formed at the cut-off threshold of 1.0.
The shape of clusters, formed by hierarchical clustering, depends on how the distance is calculated between clusters. In the single linkage method, the inter-cluster distance is measured by the closest two points between the two clusters (Figure 8, left). This method tends to produce well-separated clusters (Figure 8, middle & right). On the other hand, in the complete linkage method, the distance is calculated as the farthest points between the two clusters (Figure 9, left). The resulting clusters tend to be compact in size, but not necessarily well-separated (Figure 9, middle & right). In the average linkage method, the inter-cluster distance is calculated as the distance between the centers of gravity between two clusters. This approach is a compromise between the single and complete linkage methods.

Fig. 8. The distance calculation in the single linkage method (left). This method produces well-separated clusters (middle & right).

Fig. 9. The distance calculation in the complete linkage method (left). This method produces compact clusters (middle & right).
DBSCAN
DBSCAN stands for Density Based Spatial Clustering of Applications with Noise. It is a density-based clustering method, grouping dense clouds of data points into clusters. Any isolated points are considered not part of clusters, and are treated as noises. The DBSCAN algorithm starts out by randomly selecting a starting point. If there are a sufficiently large number of points within the neighborhood around that point, then those points are considered as part of the same cluster as the starting point. The neighborhoods of the newly added points are then examined. If there are data points within these neighborhoods, then those points are also added to the cluster. This process is repeated until no more points can be added to this particular cluster. Then another point is randomly selected as a starting point for another cluster, and the cluster formation process is repeated until no more data points are available to be assigned to clusters (Figure 10). If data points are not within the neighborhood of any other data points, such data points are considered as noises. Clusters of any shape can be formed by the DBSCAN algorithm (Figure 11).
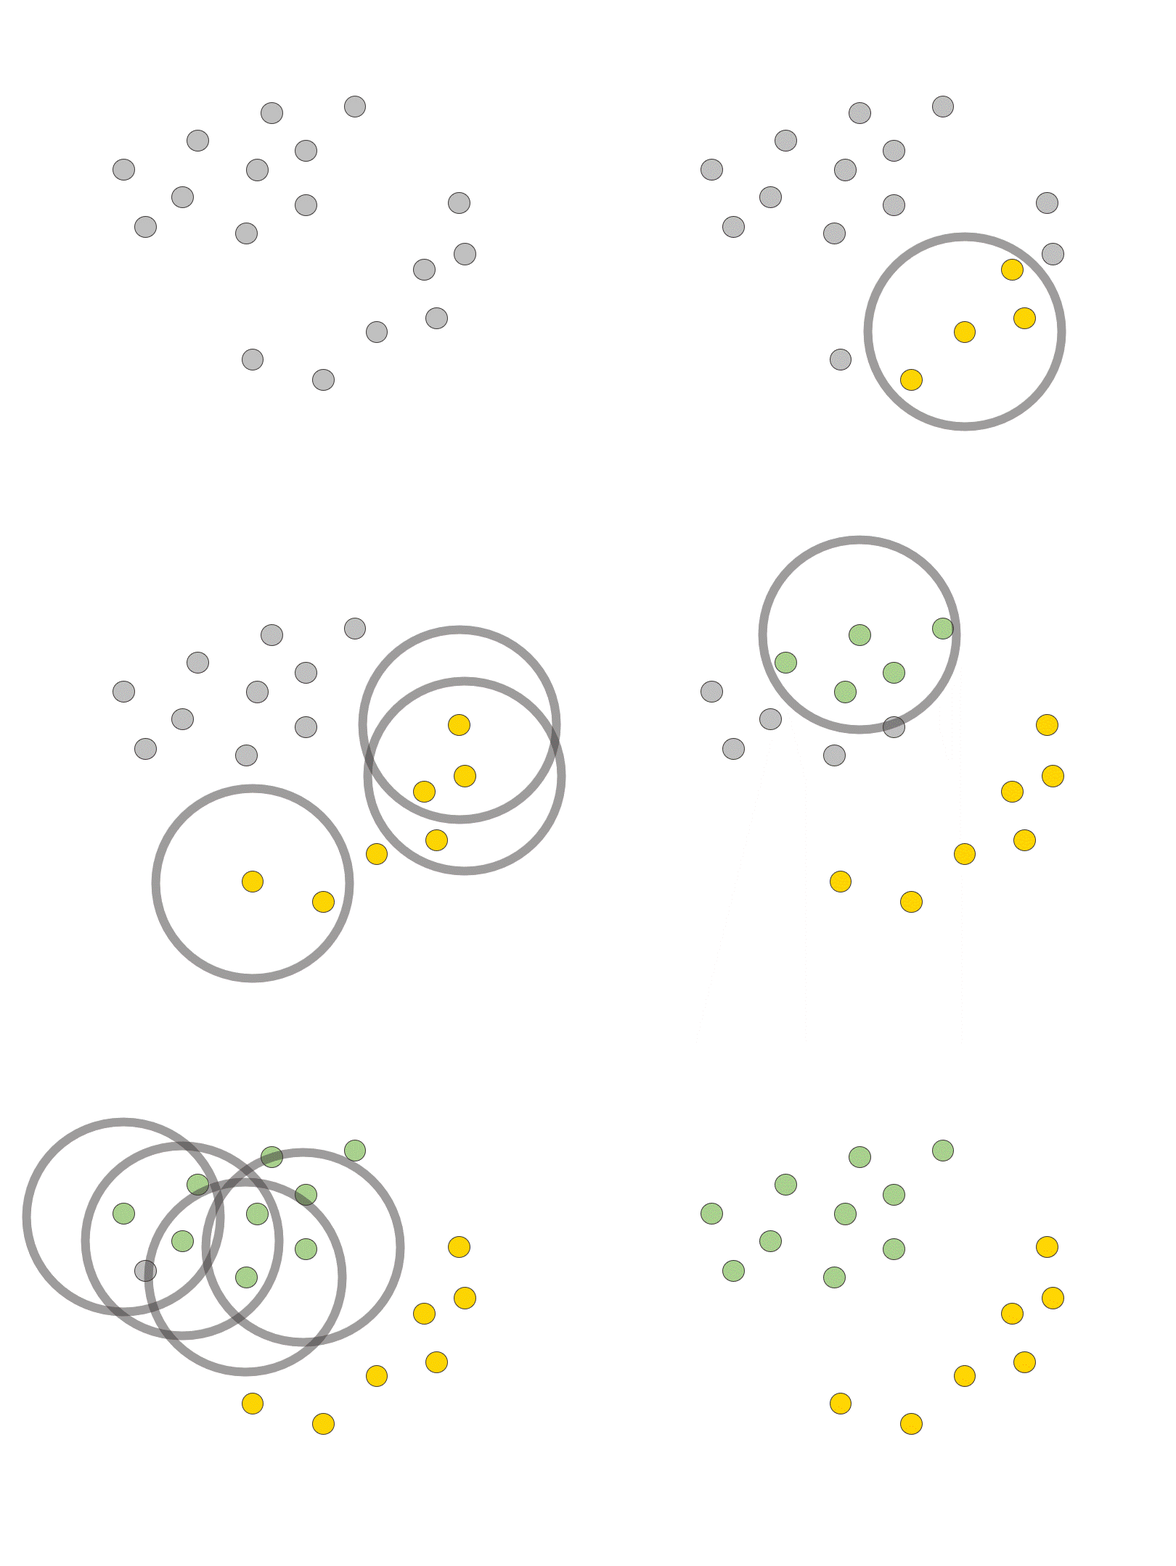
Fig. 10. The cluster formation process with the DBSCAN algorithm.

Fig. 11. Examples of clusters formed by DBSCAN.
Clustering Nodes in KNIME Analytics Platform
The three clustering algorithms described above, k-Means, hierarchical clustering, and DBSCAN, are available in KNIME Analytics Platforms as k-Means, Hierarchical Clustering, and DBSCAN nodes, respectively. These nodes run the clustering algorithm and assign cluster labels to data points. Here is an example workflow Clustering on simulated clustered data with these clustering methods (Figure 12). You can download this workflow from the KNIME Hub to try out yourself.
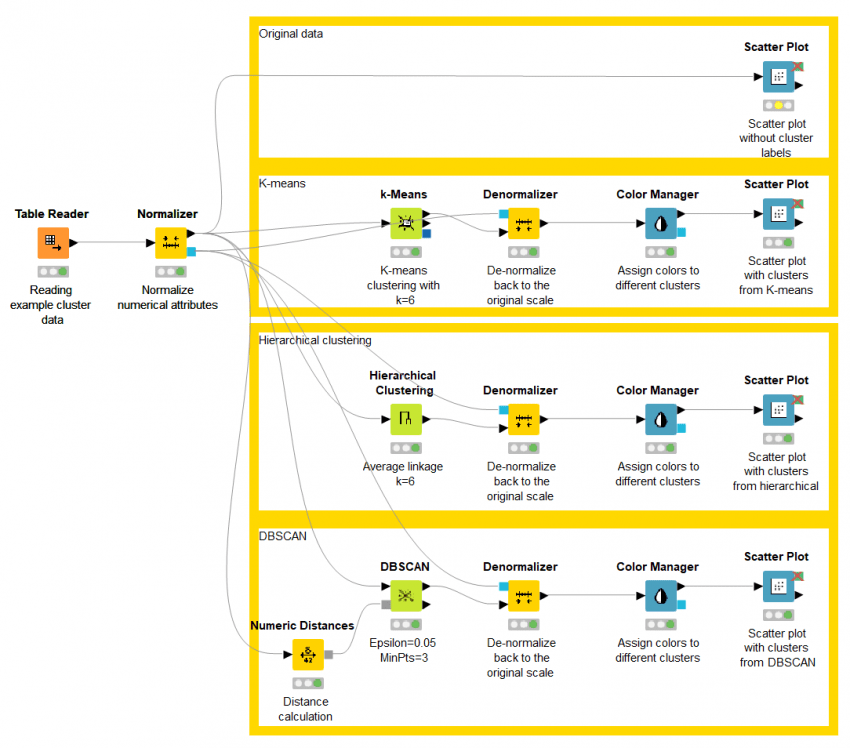
Fig. 12. Example workflow - Clustering on simulated clustered data- implementing three clustering algorithms.
As an example, the simulated clustered dataset from the beginning (Fig. 1) is analyzed with the three clustering algorithms. The resulting clusters are shown in Figure 13. Since clustering algorithms deal with unlabeled data, cluster labels are arbitrarily assigned. It should be noted that we set the number of clusters K=6 in the k-Means and the hierarchical clustering, although in a realistic scenario such information is unavailable. As you can see in this example, the three methods produce very similar clusters.
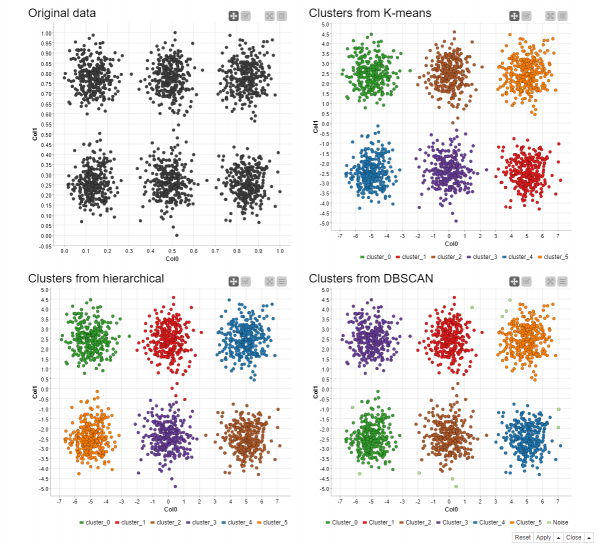
Fig. 13. Clusters discovered in the simulated data by the k-Means clustering (top right), hierarchical clustering (bottom left), and DBSCAN (bottom right). The original data (top left) are also shown as the reference.
In a real dataset, however, not all clustering algorithms perform the same. In the next example, the iris data (consisting of 3 classes of irises along with 4 numerical features) are analyzed with the same algorithms. The workflow, Clustering on the Iris data, is available on KNIME Hub at https://kni.me/w/zZheoPIKtcJ8rTJb. There are two major concentrations of data points in this dataset, with a clear gap between them (Figure 14, top left). I refer to them as the upper and lower clouds. As the k-Means clustering tends to produce convex clusters of similar sizes, it separates the upper cloud roughly in the middle (Figure 14, top right). As for the hierarchical clustering, we use the average linkage method, favoring both compact and well-separated clusters. Since there is no apparent gap in the upper cloud, it is split into one compact cluster and one larger cluster (Figure 14, bottom left). The results from the k-Means and the hierarchical clustering are driven by the fact that we set K=3 in both methods. As for the DBSCAN method, the upper cloud is identified as a single cluster (Figure 14, bottom right).
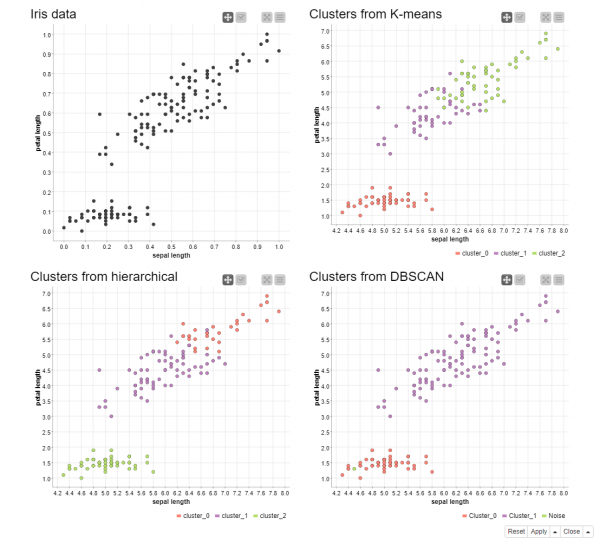
Fig. 14. Clusters discovered in the iris data by the k-Means clustering (top right), hierarchical clustering (bottom left), and DBSCAN (bottom right). The original data (top left) are also shown as the reference.
Conclusion
The methods presented here are just a few examples of clustering algorithms. There are many other clustering algorithms. As you have seen so far, different clustering algorithms produce different types of clusters. As with many machine learning algorithms, there is no single clustering algorithm that can work in all scenarios identifying clusters of any shape, size, or density that may be disjoint, touching, or overlapping. Therefore it is important to select an algorithm that finds the type of clusters you are looking for in your data.
Bio: Satoru Hayasaka was trained in statistical analysis of various types of biomedical data. He has taught several courses on data analysis geared toward non-experts and beginners. Prior to joining KNIME, Satoru taught introductory machine learning courses to graduate students from different disciplines. Based in Austin, TX, he is part of the evangelism team, and he continues teaching machine learning and data mining using KNIME software. Satoru received his PhD in biostatistics from the University of Michigan, and completed his post-doctoral training at University of California, San Francisco.
As first published on the KNIME Blog.
Original. Reposted with permission.
Related:
- Mastering Clustering with a Segmentation Problem
- Centroid Initialization Methods for k-means Clustering
- Key Data Science Algorithms Explained: From k-means to k-medoids clustering
