Building a Visual Search Engine – Part 2: The Search Engine
Ever wonder how Google or Bing finds similar images to your image? The algorithms for generating text based 10 blue-links are very different from finding visually similar or related images. In this article, we will explain one such method to build a visual search engine. We will use the Caltech 101 dataset which contains images of common objects used in daily life.
Editor's note: You can find part one of this article here.
Task: The task is to generate a ranked list of images which are semantically similar to the query image.
Dataset
We will split our dataset into two parts: training and evaluation. From each class, we will randomly sample 20 images and create an evaluation set out of it. The remaining images will be part of the training set. We further split the evaluation set into two parts, query set and candidate set. We will take 5 images from each class of the evaluation set and make it part of the query set and the remaining images in the evaluation set are part of the candidate set. This is done to calculate the evaluation metric.
For each query set image, the system generates a ranked list of images from the evaluation set. Then the metric defined below is used to evaluate the performance of the system.
Metrics
We use the Precision @ K metric to measure the performance of the system.

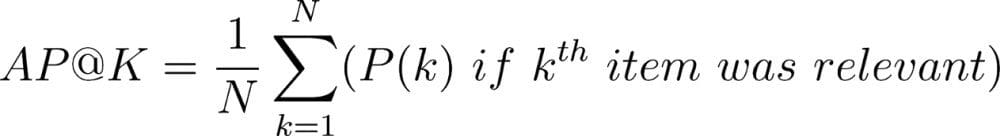
This metric does not focus on the rank of the entries and only focuses on the number of relevant entries. To capture the ranking factor of the system, we also present Average Precision(AP) on the dataset.
Methods
For this exercise, we present two baselines.
Baseline 1: In this method, we randomly take 10 samples from the candidate set across all classes. We do this for each query and calculate the metric.
Baseline 2: In this method, we use the embeddings generated from MobileNetV2 model and use cosine distance as similarity metric to rank candidate entries.
Note: We are aware that both of these methods make no use of the training split. These methods only present baselines for the system
Results
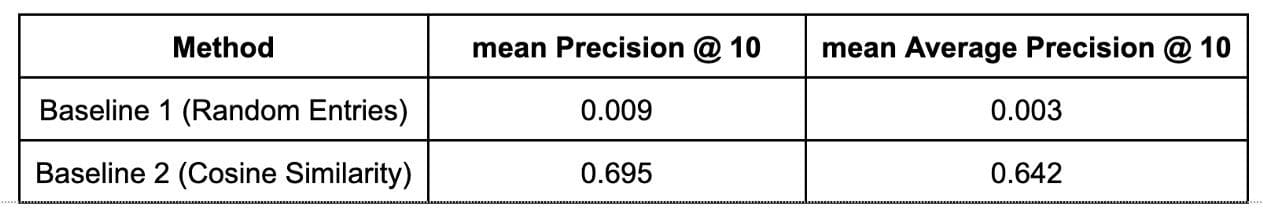
Quantitative Results
We use the method defined in the dataset section to calculate evaluation metrics.
Qualitative Results
The results below are presented for baseline 2 method (cosine similarity)
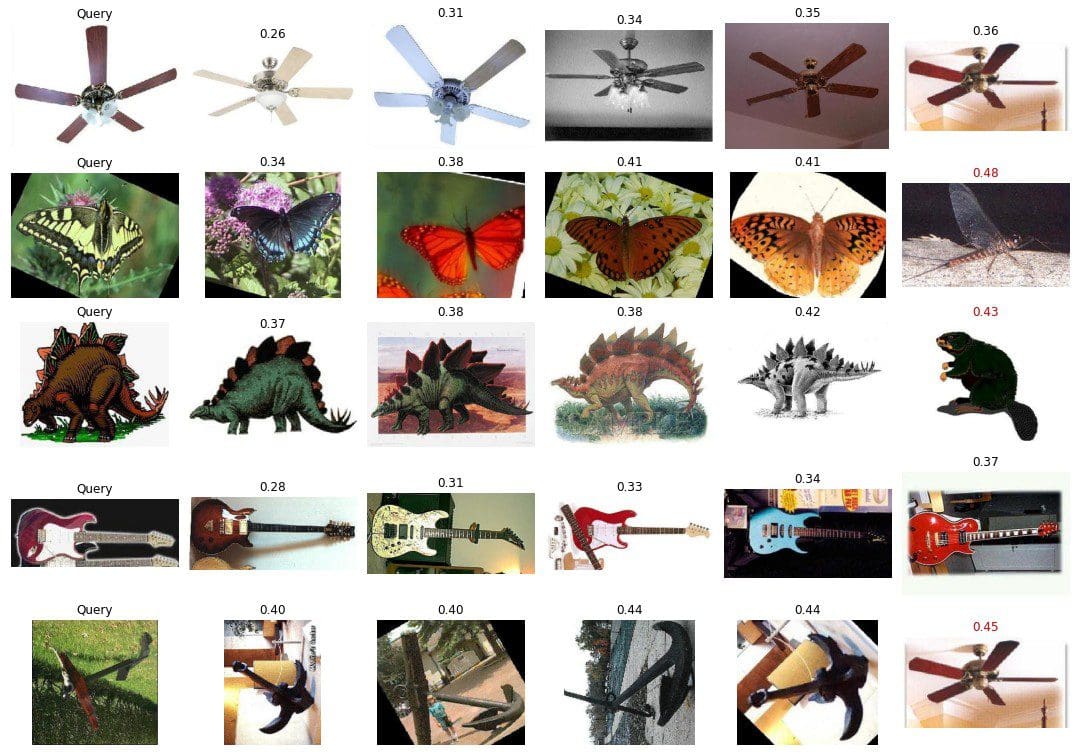
Sample search results
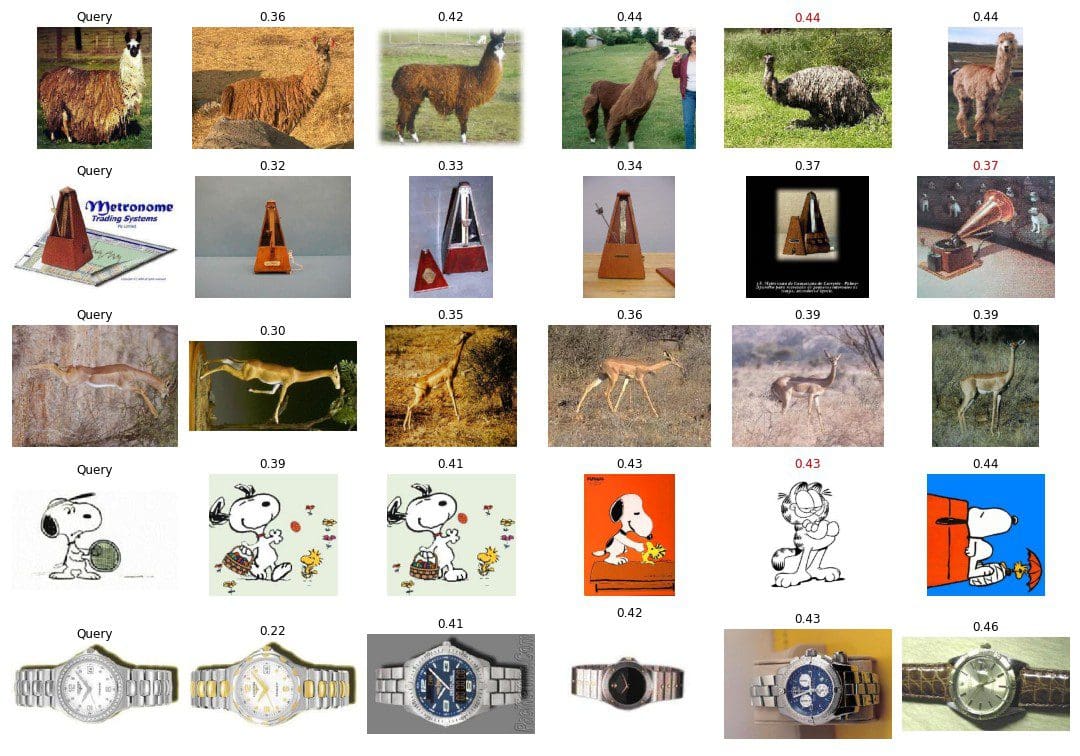
Sample search results
Please find the code to reproduce the metrics and results here.
Future Scope
Data Collection and Labelling: To create a full-fledged image search engine, we need to revisit our requirements for this system. Does this system need to work on certain types of images? Should it work on all real life objects? Should the search focus on semantic objects present in the image or images with similar color and textures will be sufficient? These requirements will help clarify the data requirements. To create a full-fledged search engine, we need to collect millions of images from the web and maintain an index for it. After collecting the data, we need to define our task and start labelling the data for this task.
Error Analysis: We can analyse the error occurred in the cosine similarity results. We can go through the search results which were included in the top 10 results but belonged to another class. This may reveal errors like results from similar classes and results from noise class.
Methods: The existing method uses knowledge from the pre-trained MobileNetV2 model. Going forward, we can train our own model using triplet loss or contrastive loss on similar and dissimilar images. The aim here is to create an embedder which can capture the object/s in the image.
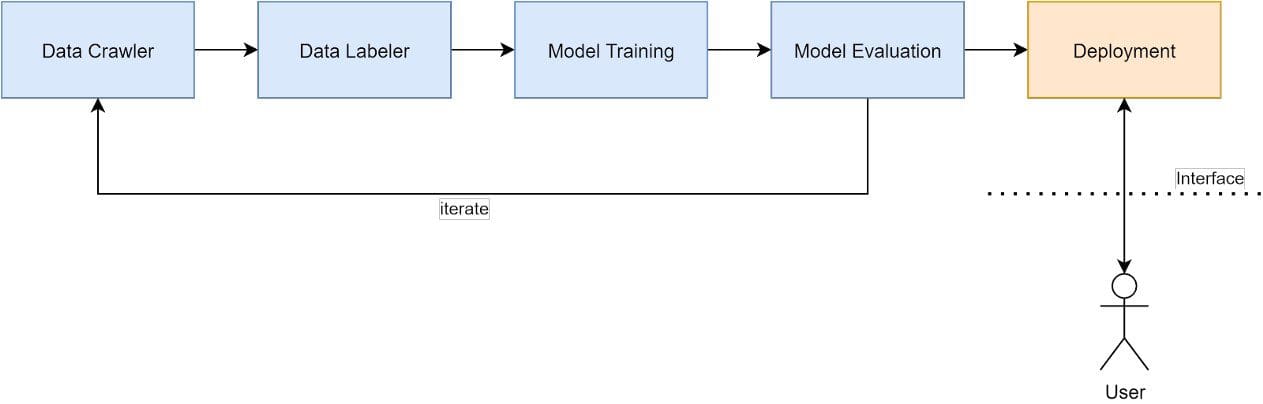
Deployment: Building a full fledged search engine will require building multiple components.
- Image Crawler: This component will crawl images for model training and validation
- Data Labeller: This component will be used by the human labeller to label and clean the collected data. The data will be collected and cleaned in multiple requirements. The data for training and validation will be processed with different pipelines.
- Model Training: This component will take the labelled data and generate model artifacts that can be used for inference.
- Model Evaluation: The component will generate the report on improvement on the model. Any change in the system should be visible in this report and changes should be driven by keeping this mind. This system should also generate failure cases to focus on.
- Embedding Pre-computation: Once a model is trained and validated, it should be used to generate the embedding for all the deployment data. The embedding should be precomputed for faster retrieval during request time.
- Real time serving and application interface: The component contains the frontend and backend for processing and generating the request
References
[1] Caltech 101, http://www.vision.caltech.edu/Image_Datasets/Caltech101/
[2] Mean Average Precision (MAP) For Recommender Systems, https://sdsawtelle.github.io/blog/output/mean-average-precision-MAP-for-recommender-systems.html
Mudit Bachhawat works as a machine learning engineer at Google, and has more than 5 years of experience in data science, deep learning, computer vision, multi-modal information retrieval, and optimization. Feel free to drop any comments or questions.