Nearest Neighbors for Classification
Learn about the K-Nearest Neighbors machine learning algorithm for classification.
K-Nearest Neighbors
K-nearest neighbors (KNN) is a type of supervised learning machine learning algorithm and is used for both regression and classification tasks.
KNN is used to make predictions on the test data set based on the characteristics of the current training data points. This is done by calculating the distance between the test data and training data, assuming that similar things exist within close proximity.
The algorithm will have stored learned data, making it more effective at predicting and categorising new data points. When a new data point is inputted, the KNN algorithm will learn its characteristics/features. It will then place the new data point at closer proximity to the current training data points that share the same characteristics or features.
What Is The ‘k’ in KNN?
The ‘K’ in KNN is a parameter that refers to the number of nearest neighbors. K is a positive integer and is typically small in value and is recommended to be an odd number.
In Layman's terms, the K-value creates an environment for the data points. This makes it easier to assign which data point belongs to which category.
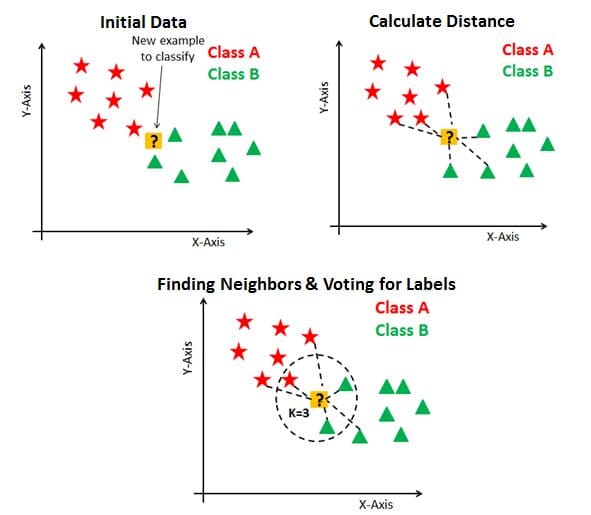
The example below shows 3 graphs. The first, the ‘Initial Data’ is a graph where data points are plotted and clustered into classes, and a new example to classify is present. In the ‘Calculate Distance’ graph, the distance from the new example data point to the closest trained data points is calculated. However, this still does not categorise the new example data point. Therefore, using k-value, essentially created a neighborhood where we can classify the new example data point.
We would say that k=3 and the new data point will belong to Class B as there are more trained Class B data points with similar characteristics to the new data point in comparison to Class A.
Source: datacamp.com
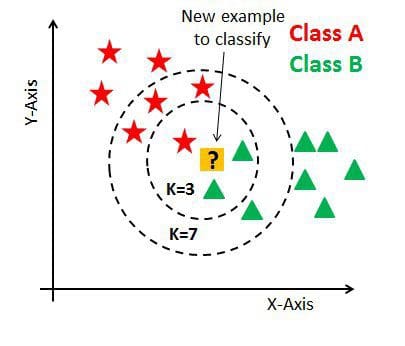
If we increase the k-value to 7, we will see that the new data point will belong to Class A as there are more trained Class A data points with similar characteristics to the new data point in comparison to Class B.
Source: datacamp.com
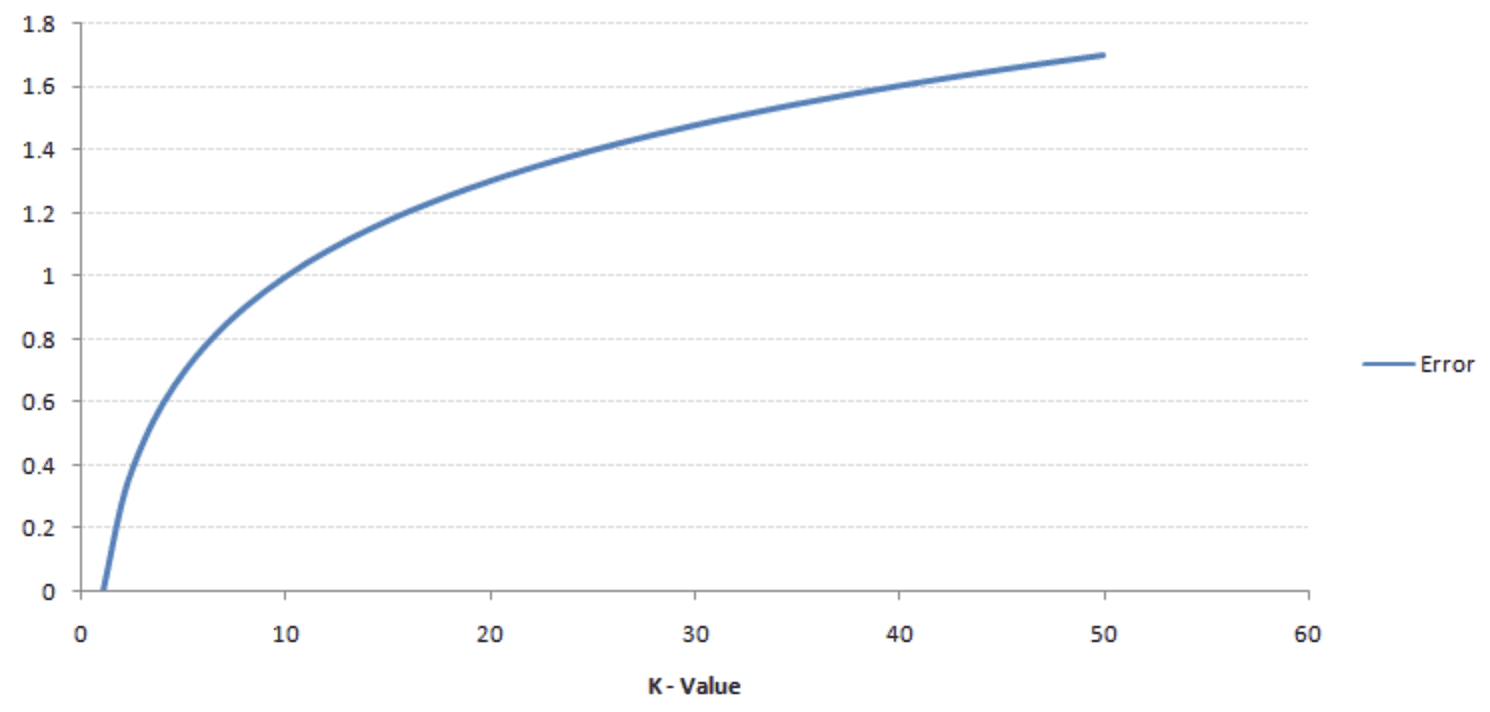
The k-value is typically a small number because, as we increase the k-value, the error rate also increases. The below graph shows this:
Source: analyticsvidhya
However, If the k-value is small then it causes a low bias but a high variance, leading to overfitting of the model.
It is also recommended that the k-value is an odd number. This is because if we are trying to classify a new data point and we only have an even number of categories/classes (e.g. Class A and Class B) it can produce inaccurate outputs. Therefore it is highly recommended to choose a K-value with an odd number to avoid a tie.
Calculating The Distance
KNN calculates the distance between data points in order to classify new data points. The most common methods used to calculate this distance in KNN are Euclidian, Manhattan, and Minkowski.
Euclidean Distance is the distance between two points using the length of a line between the two points. The formula for Euclidean Distance is the square root of the sum of the squared differences between a new data point (x) and an existing trained data point (y).
Manhattan Distance is the distance between two points is the sum of the absolute difference of their Cartesian coordinates. The formula for Manhattan Distance is the sum of the lengths between a new data point (x) and an existing trained data point (y) using a line segment on the coordinate axes.
Minkowski Distance is the distance between two points in the normed vector space and is a generalization of the Euclidean distance and the Manhattan distance. In the formula for Minkowski Distance when p=2, we get Euclidian distance, also known as L2 Distance. When p=1 we get Manhattan distance, also known as L1 distance, city-block distance, and LASSO.
The image below is the formulas:

The image below explains the difference between the three:
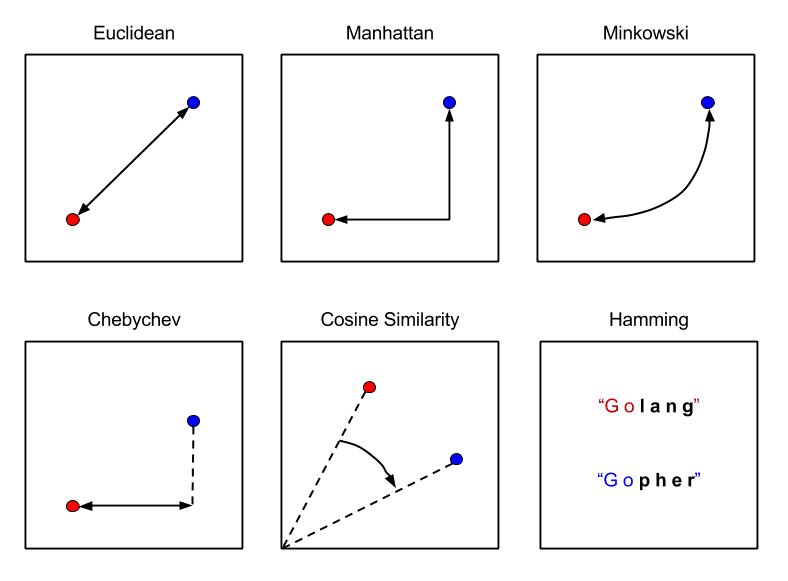
Source: Packt Subscription
How Does The KNN Algorithm Work?
Below are the steps of how a KNN algorithm works:
- Load in your dataset
- Choose a k-value. An odd number is recommended to avoid a tie.
- Calculate the distance between the new data point and the neighboring existing trained data points.
- Find the K nearest neighbor to the new data point
Below is an image that gives an overview of these steps:
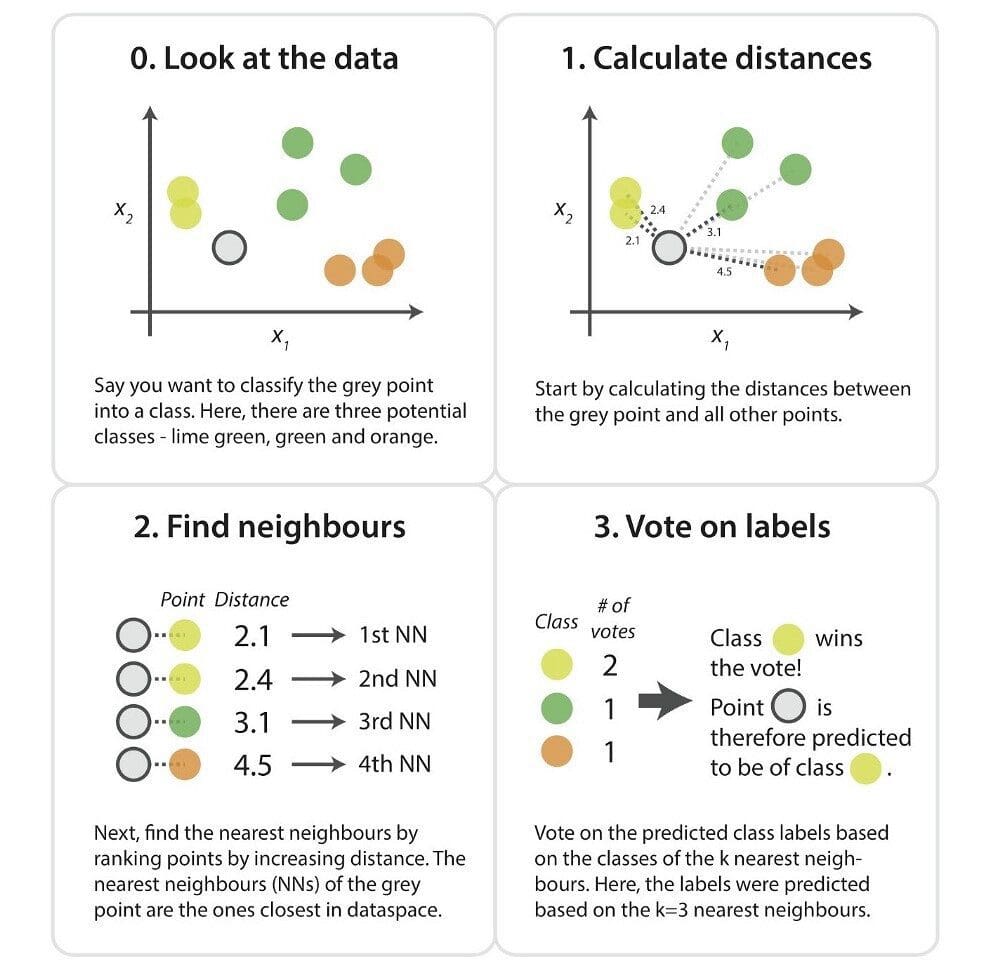
Source: kdnuggets.com
KNN Algorithm Classification Implementation
I will go through an example of the KNN algorithm being used on a Classification task using the Iris dataset
Import libraries
import numpy as np
import matplotlib.pyplot as plt
import pandas as pd
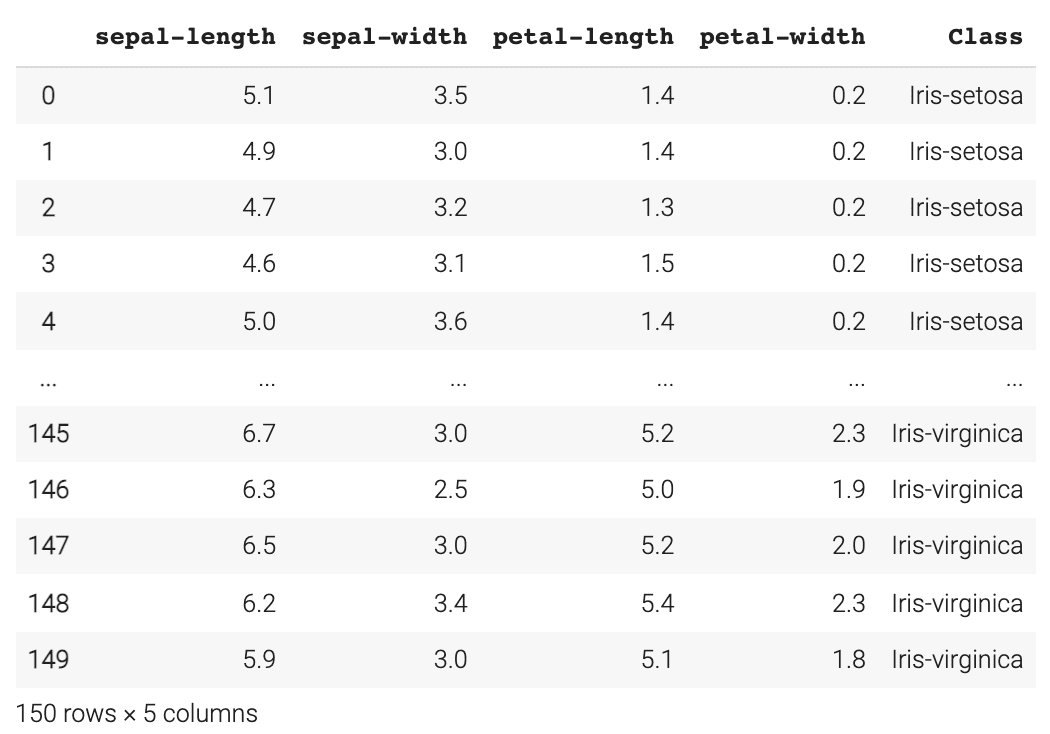
Load the Iris Dataset
url = "https://archive.ics.uci.edu/ml/machine-learning-databases/iris/iris.data"

# Assign the column namesnames = ['sepal-length', 'sepal-width', 'petal-length', 'petal-width', 'Class']

# Read the dataset in
dataset = pd.read_csv(url, names=names)
dataset
Preprocessing the data
We do this to split our dataset into its attributes and labels. The X variable will contain the first four columns of the dataset, which we refer to as the attributes and the y variable will contain the last column, which we refer to as the labels.
X = dataset.iloc[:, :-1].values
y = dataset.iloc[:, 4].values
Train Test Split
In this step, we are going to divide the dataset into training and test splits. This gives us an idea of how well the algorithm learned the training data and how well it performs on the testing data.
from sklearn.model_selection import train_test_split
X_train, X_test, y_train, y_test = train_test_split(X, y, test_size=0.20)
Feature Scaling
Feature scaling is an important element in preprocessing the data before making predictions. This method is used to normalise the range of features of the data.
from sklearn.preprocessing import StandardScaler
scaler = StandardScaler()
scaler.fit(X_train)

X_train = scaler.transform(X_train)
X_test = scaler.transform(X_test)
Making predictions with KNN
First we need to import the KNeighborsClassifier class from the sklearn.neighbors library. We then choose our k-value, in this example, I have chosen 7. Remember that it is highly recommended to choose an odd value to avoid ties.
from sklearn.neighbors import KNeighborsClassifier
classifier = KNeighborsClassifier(n_neighbors=7)
classifier.fit(X_train, y_train)
We then move onto making predictions on our test dataset.
y_pred = classifier.predict(X_test)
Accuracy of the algorithm
With sklearn.metrics, we can classification_report to evaluate the accuracy of the algorithm, looking at precision, recall and f1-score.
from sklearn.metrics import classification_report
print(classification_report(y_test, y_pred))
This is what the output looks like:
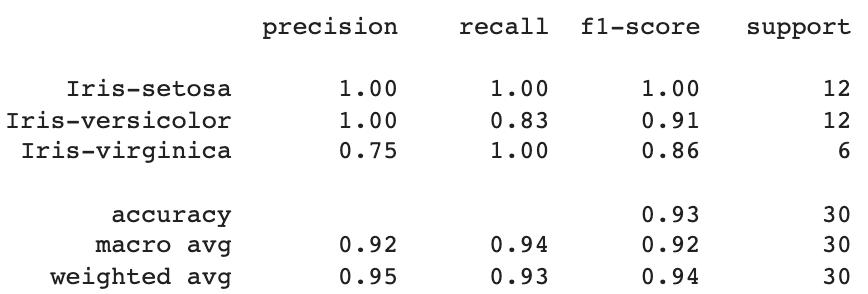
From this, we can see that the KNN algorithm classified 30 data points with an average total of 95% on precision, 93% on recall, and 94% on f1-score.
Finding the right k-value
In this example, I chose a k-value of 7. However, if we wanted to check what the best k-value is, we can produce a graph that shows the different k-values and the error rate it produces.
I will be looking at k-values between 1 and 30. A loop will be executed from 1 to 30, where during each iteration the mean error is calculated and added to the error list.
error = []
# Calculating the error rate for K-values between 1 and 30
for i in range(1, 30):
    knn = KNeighborsClassifier(n_neighbors=i)
    knn.fit(X_train, y_train)
    pred_i = knn.predict(X_test)
    error.append(np.mean(pred_i != y_test))
Plotting the k-value against error rate graph:
plt.figure(figsize=(12, 5))
plt.plot(range(1, 30), error, color='red', marker='o',
        markerfacecolor='yellow', markersize=10)
plt.title('Error Rate K Value')
plt.xlabel('K Value')
plt.ylabel('Mean Error')
Output of graph:
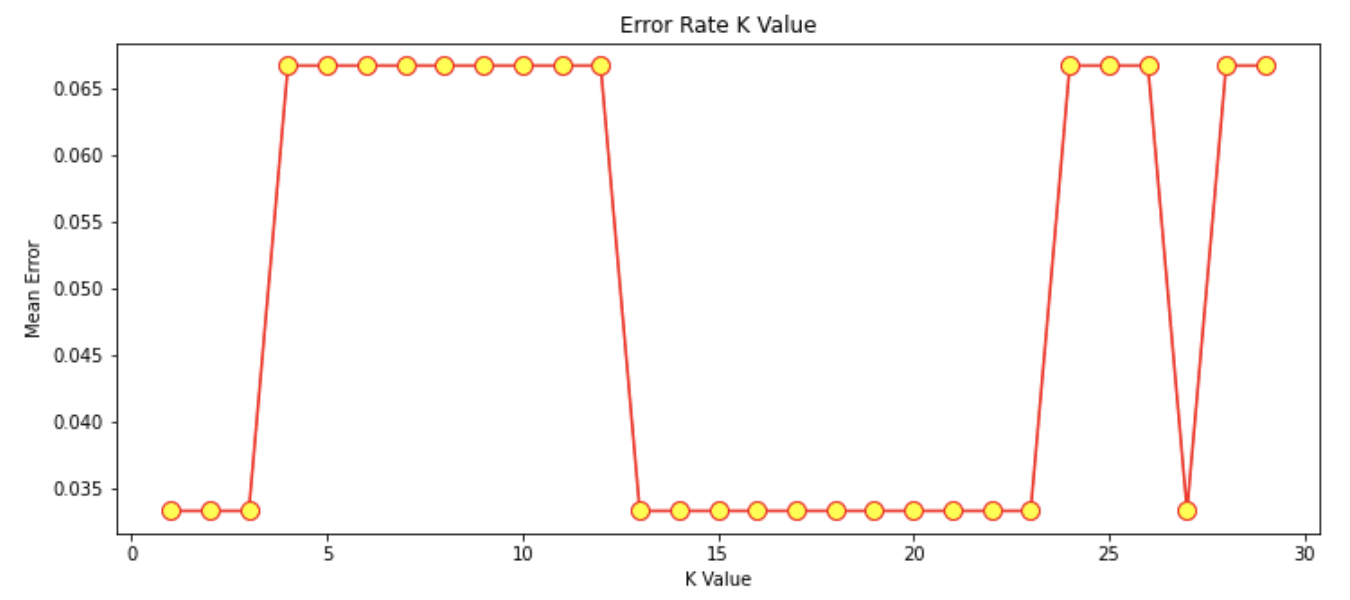
Source: Author Image
From this graph, we can see that the k-values that give us a Mean Error of 0 are predominantly between k-value 13 - 23.
Summary
KNN is a simple and easy algorithm to implement and can be used for both regression and classification tasks. The K-value is a parameter that refers to the number of nearest neighbors. It is recommended that the k-value is an odd number. There are different distance metrics you can use, but the most common ones are Euclidian, Manhattan, and Minkowski.
Nisha Arya is a Data Scientist and Freelance Technical Writer. She is particularly interested in providing Data Science career advice or tutorials and theory based knowledge around Data Science. She also wishes to explore the different ways Artificial Intelligence is/can benefit the longevity of human life. A keen learner, seeking to broaden her tech knowledge and writing skills, whilst helping guide others.