Data-centric AI and Tabular Data
DALL-E, LaMDA, and GPT-3 all had celebrity moments recently. So, where’s the glamorous, high-performance model that’s mastered tabular data?

Image by Editor
It’s fantastic that AI models are starting to become household names. DALL-E, LaMDA, and GPT-3 all had celebrity moments recently.
So, where’s the glamorous, high-performance model that’s mastered tabular data?
Even though the world’s businesses primarily rely on tabular data, computer vision and natural language processing models have seized the spotlight. Academic research and industry innovation have focused on CV and NLP. That work has brought about amazing, world-changing applications across industries, such as autonomous vehicles, augmented reality, and nearly human-level text-generation and conversation tools.
At the same time, despite the importance of tabular data for businesses, only a tiny proportion of AI research has focused on improving methods for working with this data format. For example, searching the Computer Science arXiv repository of academic research returns about 900 results for papers mentioning “tabular” – but over 5,000 for “NLP” and over 81,000 for “computer vision.”
Every spreadsheet you’ve ever known has contained tabular data. Capture and analysis of tabular data is why we have thousands of database management, BI, CRM, ERP, CS, and other business tools around, creating trillions of dollars in market value. Yet analysis of tabular data could benefit from more advanced approaches, including all phases of the data prep, modeling, and deployment process. So why don’t we — the data science community at large — spend more of our time and resources developing techniques for dealing with tabular data?
I’ll explore three main reasons tabular data is neglected today, and suggest a twist on a trend — specifically, data-centric AI — that the data world needs to adopt more widely, including within the business uses of AI.
Tabular Data Doesn’t Seem Sexy, But It’s Essential
Spreadsheets aren’t exactly inspirational for most people. More likely, you’ll hear complaints about how tedious people find those rows and columns of data. However, even for the rare spreadsheet fans, computer vision and NLP projects have been alluring. Making a computer understand images or natural language may feel like helping to bring about digital evolution. In contrast, tabular data feels more like simply talking with a computer in its native language.
Yet to advance broader adoption of AI among businesses — and bring innovation to boost revenue-driving AI initiatives — it’s time to find out how enticing tabular data can be.
Tabular Data is Harder to Access for Research
Another reason computer vision and NLP research has leapfrogged research on tabular data is that the raw material for these projects is so much more accessible. With billions of photos on the internet and billions of web pages containing text, there are limitless possibilities for building training corpora for image and language projects that inform powerful models like DALL-E and LaMDA.
In contrast, publicly available tabular data — especially from businesses — is scarce by comparison. Data science students practice on the same tabular datasets over and over again (irises, anyone?). Researchers may struggle to find varied tabular datasets beyond those in well-known repositories. Understandably, businesses are reluctant to release internal data, likely in tabular form, that reflects customer activity or shapes their business strategies. And let’s not forget that there are numerous regulations restricting sharing such data outside of its specified usage. Without access to many varied, large, and business-oriented datasets, advancements in approaches to tabular data have stalled.
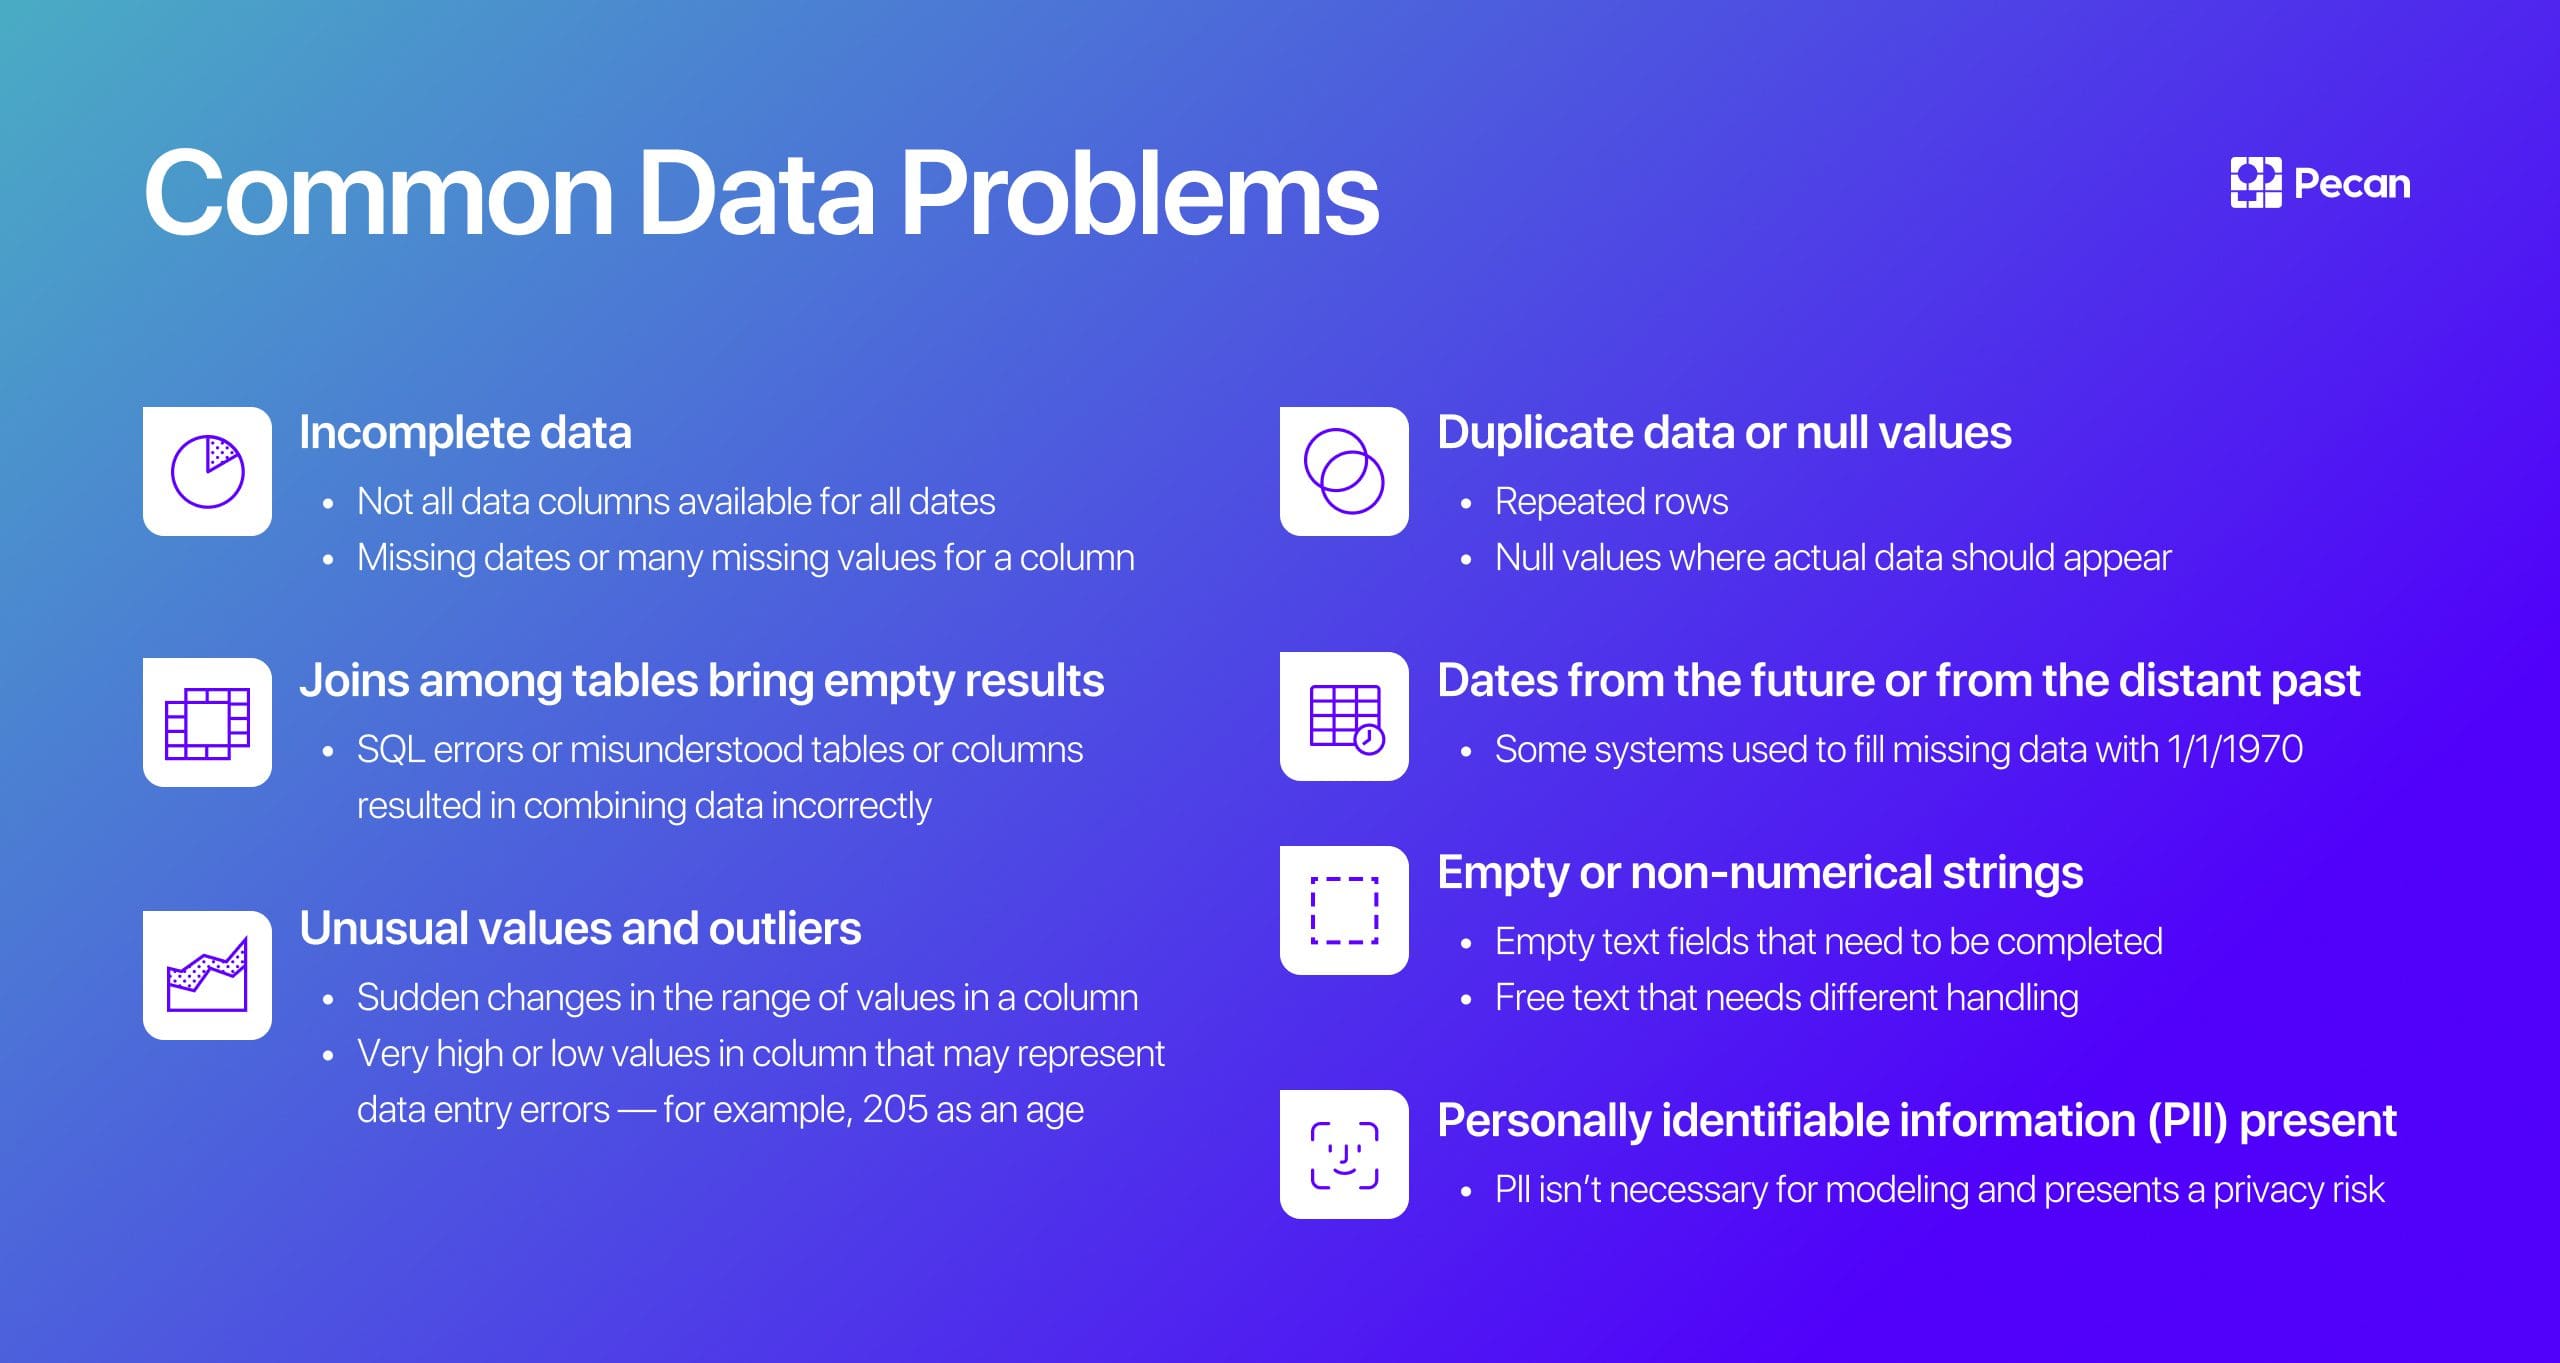
Image from Pecan AI
Tabular Data is Different
A pixel presents a large yet finite realm of possibilities. A photo of a dog or a child’s crayon drawing, a short story or an epic poem: Whatever the content of an image or text, digitization and pre-processing reshape it into a consistent format that machine learning algorithms can use.
The lack of this underlying consistency in tabular data is a major challenge for efficient machine learning. Images and text might seem more complex — but it is just as challenging, if not more so, to find the common structure underlying most tabular datasets. Each column in a table is different and may not be clearly identified. Data types may not be provided or accurately configured. For example, do the five-digit numbers in a column represent household income or a ZIP code? Do the 0s and 1s in another column mean “no” and “yes,” or do they stand for another binary variable? And — the perennial question — what is this date format?
These inconsistencies and uncertainties usually make preparing tabular data a daunting task, especially when data tables need to be combined from disparate sources across an organization. Matching like information from different sources and standardizing it for a single modeling pipeline can be difficult. No wonder that some data scientists still report spending over 70% of their time on data prep tasks, considering it the equivalent of digital janitorial work.
Artisanal Approaches to Data Prep and Feature Engineering are Failing Us
Because tabular data can take so many forms, data analysts and data scientists have adopted a situational approach to preparing it for analysis and modeling. Every dataset undergoes a unique combination of cleansing, combining, pre-processing, and feature engineering, with the process reinvented for every new project.
On the surface, it sounds like it could be good to take a highly specific, “artisanal” approach to every data project. But in reality, this incredibly time-consuming and tedious work rarely pays off. It delays the ROI of data projects by weeks, if not months. Data scientists try to decide which new features to create based on intuition and experience, but they inadvertently introduce their own biases into the feature engineering and selection process. This idiosyncratic component of data science reduces the objectivity that contributes to the unique value of machine learning.
Despite its drawbacks, the impromptu approach to data prep persists because of a widespread perception that each tabular dataset is truly unique. In reality, tabular data’s unpredictable elements can be rather predictable, at least when examined within a narrow set of circumstances.
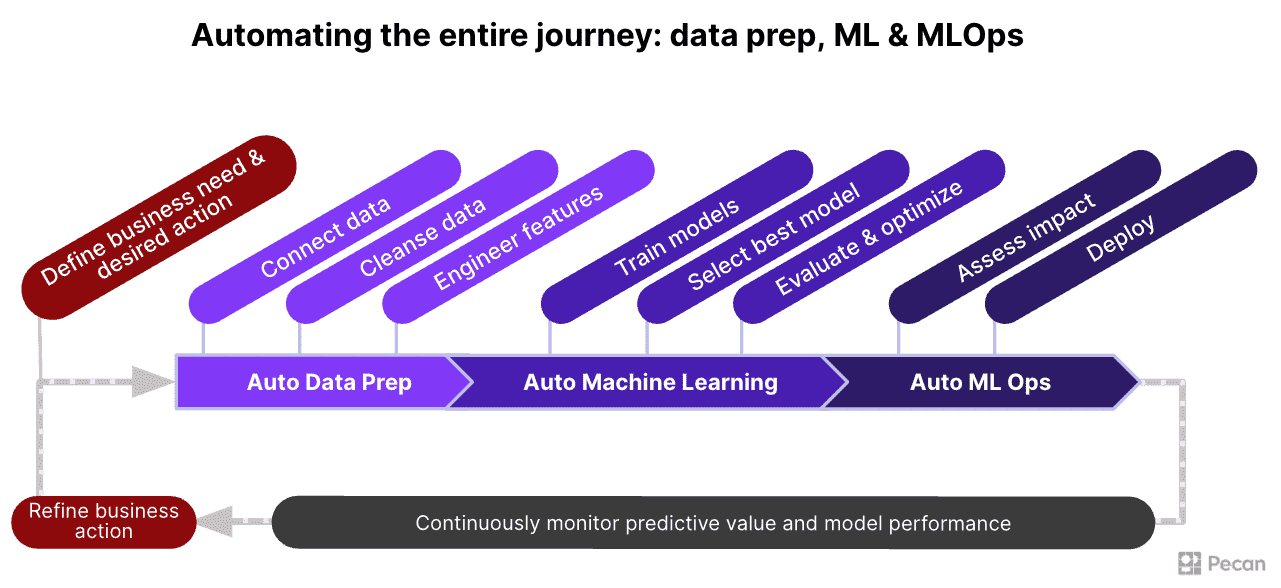
Image from Pecan AI
Deriving a Repeatable Data Prep and Feature Engineering Framework for Specific ML Applications
When businesses use their data for modeling related to frequent business concerns — such as customer churn or lifetime value — they typically rely on similar datasets. Those datasets often share common elements. If you examine enough of these datasets, it’s possible to identify a set of data preparation and feature engineering tasks that will always have to be carried out on those datasets. Acknowledging those commonalities is the first step toward developing a repeatable process.
With a relatively narrow focus on a specific application of predictive modeling, data preparation and feature engineering don’t have to be a situational, ad hoc process that’s reinvented with every new dataset and project. Instead, these tasks can be automated with well-crafted code and efficiently executed across large quantities of data and multiple projects. This automated approach is far quicker and more efficient than the typical improvisational process widespread in data science.
Some might hesitate to automate feature engineering along with data cleansing, but this process should also be automated. In deep learning, we allow models to build the right features. But for some reason, we still insist on hand-crafting features for tabular data. Automating feature engineering on tabular data removes bias, and automation allows for the creation, evaluation, and selection of the most truly useful features from among far more than a human could manually create and examine.
Most importantly, a well-thought-out, rigorously applied approach also maximizes the quality of the resulting dataset. Because in the end, high-quality data is critical to machine learning success — a fact AI experts acknowledge more widely today.
Data-Centricity Must Include Tabular Data
Conversations in AI are increasingly citing the concept of “data-centric AI.” As one online hub for these discussions says, data-centric AI is “the discipline of systematically engineering the data used to build an AI system.” Data science leaders like Andrew Ng have popularized this idea. However, again, these discussions have focused on computer vision and NLP applications.
The concept of data-centric AI is a counterbalance to our field’s longstanding emphasis on “big data” and on endlessly refining and tuning machine learning models. Instead of big data, the data-centric argument goes, we should focus on quality data that can train even simpler models effectively for good performance.
This perspective also says that algorithmic innovation and time-consuming tinkering with hyperparameters can together return only so much improvement in model performance. However, a stronger focus on the quality of training data can provide a much more significant boost to model performance without reinventing the algorithmic wheel for every new project.
What would it mean to take a data-centric approach to tabular data, as well as image and text data? As discussed above, tabular data can be challenging to interpret, with less readily apparent consistency among datasets than is easily available for images or text. Rows and columns can contain many kinds of data and mean many different things. This flexible nature means that it’s more important to pay close attention to the quality of tabular data. It’s unfortunately relatively easy for data errors of various types to persist throughout the modeling process and for data professionals to overlook potentially valuable features in a subjective, unsystematic feature engineering process.
Suppose we spend more time optimizing the quality of the tabular data we feed into models. We can then obtain significant performance gains — without using the latest cutting-edge algorithms or hand-building artisanal models for every project.
And as described above, it’s possible to make the data cleansing and feature engineering process far more manageable and repeatable through thoughtfully designed automation, building on recurring frameworks among tabular data commonly used in frequent business situations. This approach is precisely what the company I co-founded, Pecan AI, is doing for high-impact business use cases related to predicting customer behavior. We’ve automated much of the data preparation and feature engineering process to make predictive analytics faster, more accessible, and still exceptionally accurate.
Despite the business significance of tabular data and the vast potential to innovate with this form of data, the word “tabular” is now largely absent from discussions of data-centric AI. It’s time to bring more innovation and automation to how we work with this business-critical data format — especially since better model performance in business applications can dramatically impact businesses’ outcomes. I’m excited to see what we can achieve in both the technical and business realms with a data-centric approach to tabular data.
Noam Brezis is the co-founder and CTO of Pecan AI, the world’s only low-code predictive analytics company that puts the power of data science directly into the hands of business intelligence, operations, and revenue teams. Pecan enables companies to harness the full power of AI and predictive modeling without requiring any data scientists or data engineers on staff. Noam holds a PhD in computational neuroscience, an MS in cognitive psychology, and a BA in economics and psychology, all from Tel Aviv University.