More Performance Evaluation Metrics for Classification Problems You Should Know
When building and optimizing your classification model, measuring how accurately it predicts your expected outcome is crucial. However, this metric alone is never the entire story, as it can still offer misleading results. That's where these additional performance evaluations come into play to help tease out more meaning from your model.
Evaluating a model is a major part of building an effective machine learning model. The most frequent classification evaluation metric that we use should be ‘Accuracy’. You might believe that the model is good when the accuracy rate is 99%! However, it is not always true and can be misleading in some situations. I’m going to explain the 4 aspects as shown below in this article:
- The Confusion Matrix for a 2-class classification problem
- The key classification metrics: Accuracy, Recall, Precision, and F1- Score
- The difference between Recall and Precision in specific cases
- Decision Thresholds and Receiver Operating Characteristic (ROC) curve
The Flow of Machine Learning Model
In any binary classification task, we model can only achieve two results, either our model is correct or incorrect in the prediction where we only have two classes. Imagine we now have a classification task to predict if an image is a dog or cat. In supervised learning, we first fit/train a model on training data, then test the model on testing data. Once we have the model’s predictions from the X_test data, we compare it to the true y_values (the correct labels).
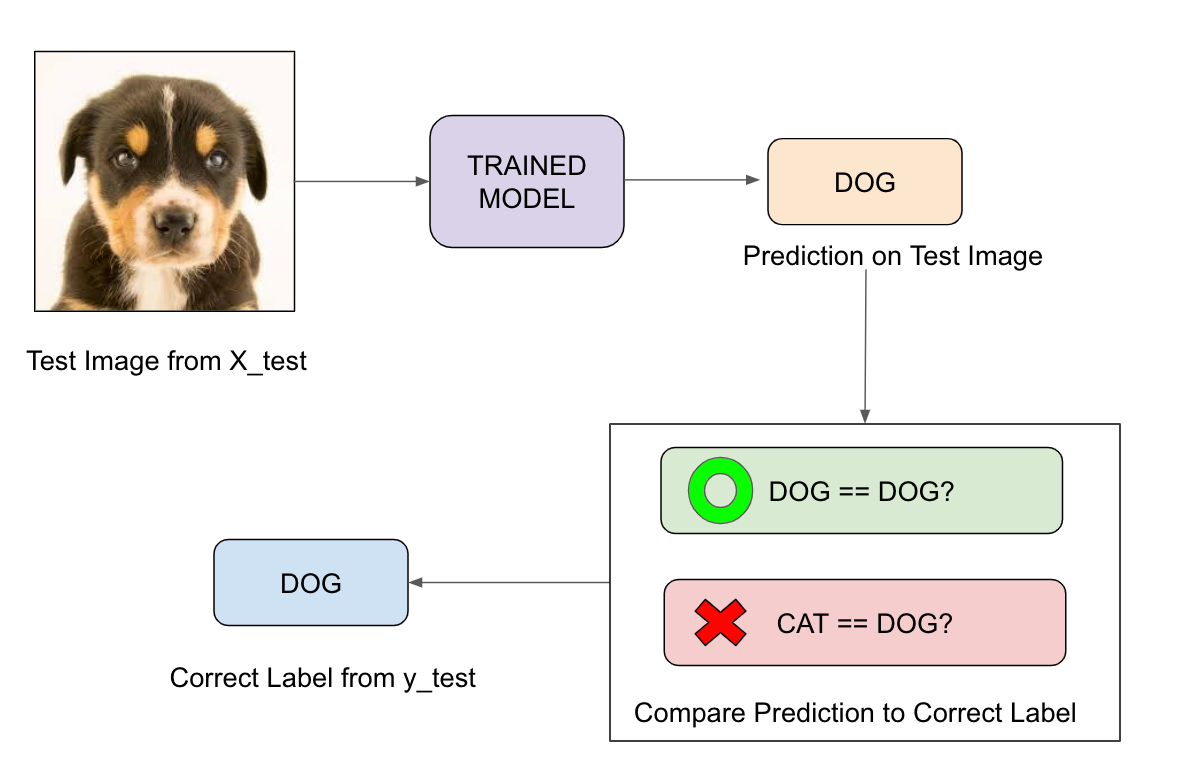
We feed the image of dog into our trained model before the model prediction. The model predicts that this is a dog, and then we compare the prediction to the correct label. If we compare the prediction to the label of “dog,” it is correct. However, if it predicts that this image is a cat, this comparison to the correct label would be incorrect.
We repeat this process for all the images in our X test data. Eventually, we will have a count of correctly matched and a count of incorrect matches. The key realisation is that not all incorrect or correct matches hold equal value in reality. Therefore a single metric won’t tell the whole story.
As mentioned, accuracy is one of the common evaluation metrics in classification problems, that is the total number of correct predictions divided by the total number of predictions made for a dataset. Accuracy is useful when the target class is well balanced but is not a good choice with unbalanced classes. Imagine we had 99 images of the dog and only 1 image of a cat in our training data, our model would be simply a line that always predicted dog, and therefore we got 99% accuracy. Data is always imbalanced in reality, such as Spam email, credit card fraud, and medical diagnosis. Hence, if we want to have a full picture of the model evaluation, other metrics such as recall and precision should also be considered.
Confusion Matrix
Evaluation of the performance of a classification model is based on the counts of test records correctly and incorrectly predicted by the model. The confusion matrix provides a more insightful picture which is not only the performance of a predictive model, but also which classes are being predicted correctly and incorrectly, and what type of errors are being made. To illustrate, we can see how the 4 classification metrics are calculated (TP, FP, FN, TN), and our predicted value compared to the actual value in a confusion matrix is clearly presented in the below confusion matrix table.
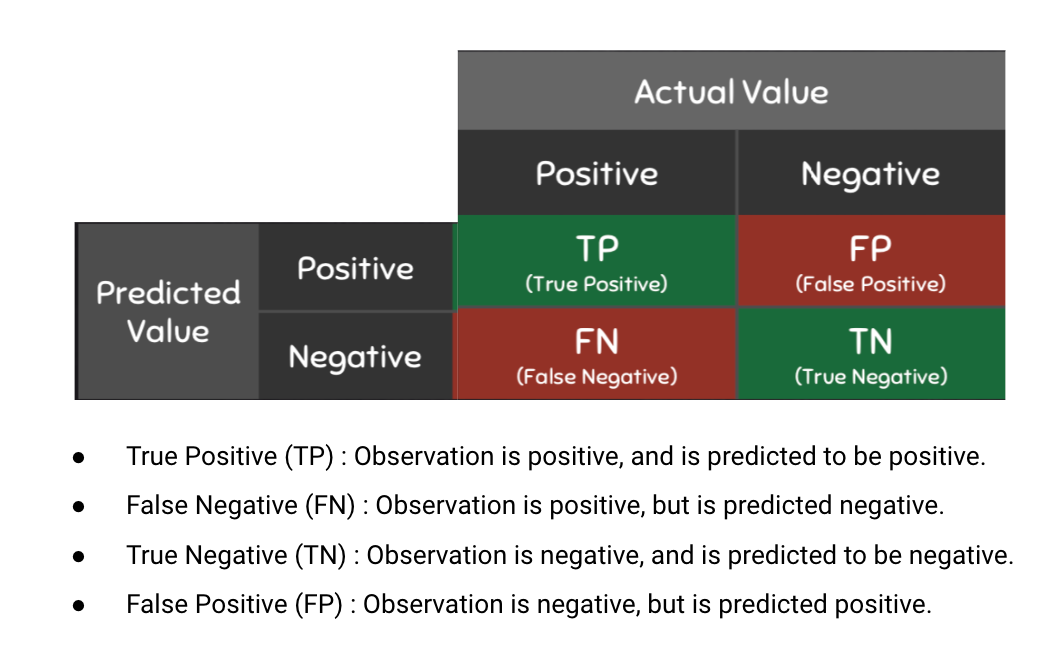
Possible Classification Outcomes: TP, FP, FN, TN.
The confusion matrix is useful for measuring Recall (also known as Sensitivity), Precision, Specificity, Accuracy, and, most importantly, the AUC-ROC Curve.
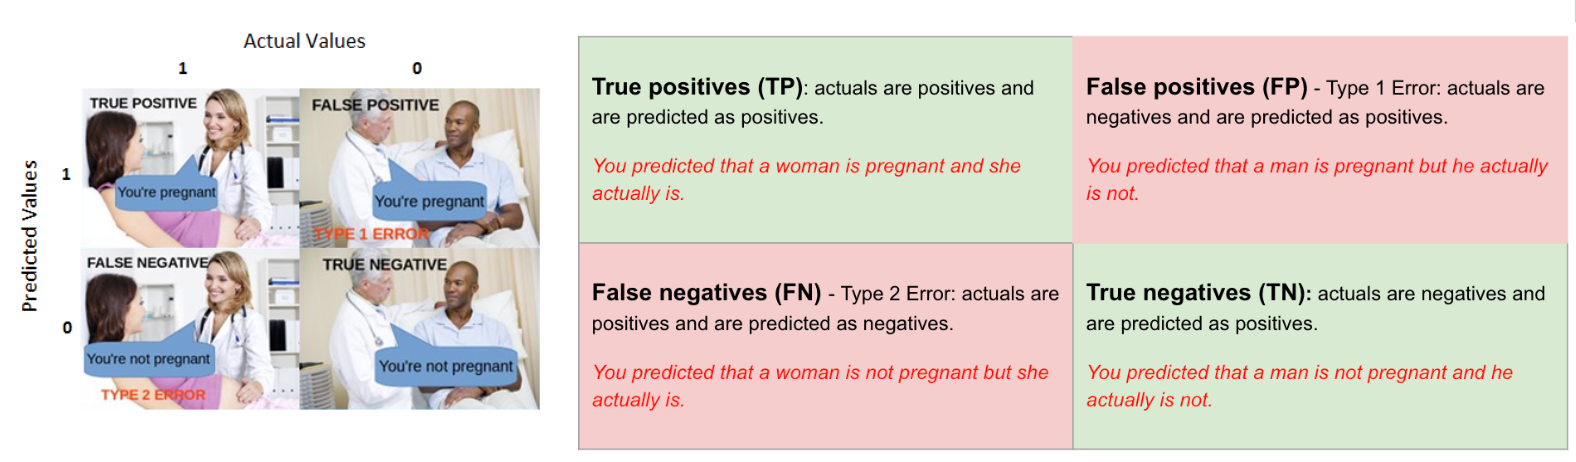
Do you feel confused when you were reading the table? That’s expected. I was also before. Let me put it in an interesting scenario in terms of pregnancy analogy to explain the terms of TP, FP, FN, TN. We can then understand Recall, Precision, Specificity, Accuracy, and, most importantly, the AUC-ROC Curve.
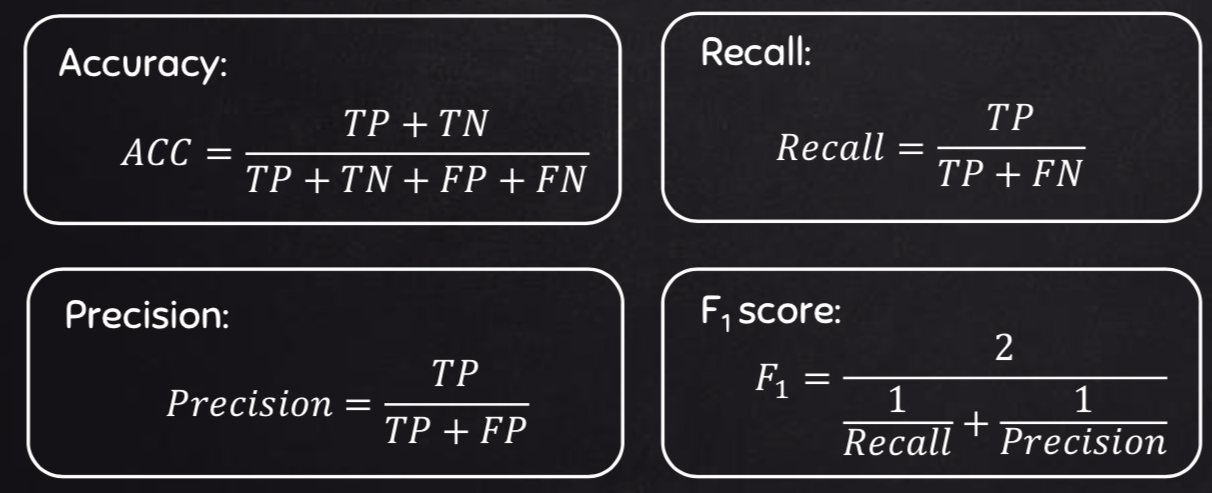
The Equations of 4 Key Classification Metrics
Recall versus Precision
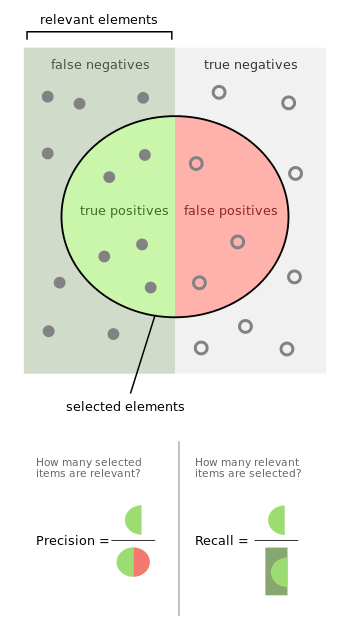
Precision is the ratio of True Positives to all the positives predicted by the model.
Low precision: the more False positives the model predicts, the lower the precision.
Recall (Sensitivity)is the ratio of True Positives to all the positives in your Dataset.
Low recall: the more False Negatives the model predicts, the lower the recall.
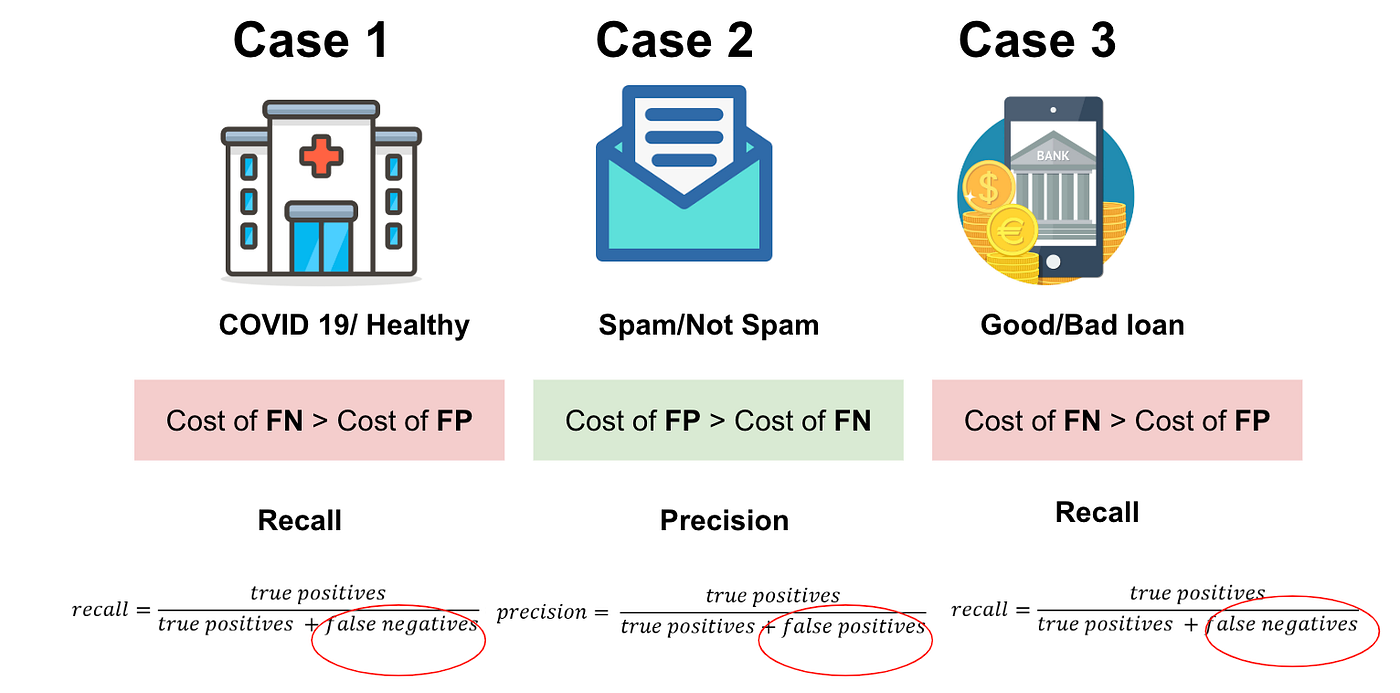
The idea of recall and precision seems to be abstract. Let me illustrate the difference in three real cases.
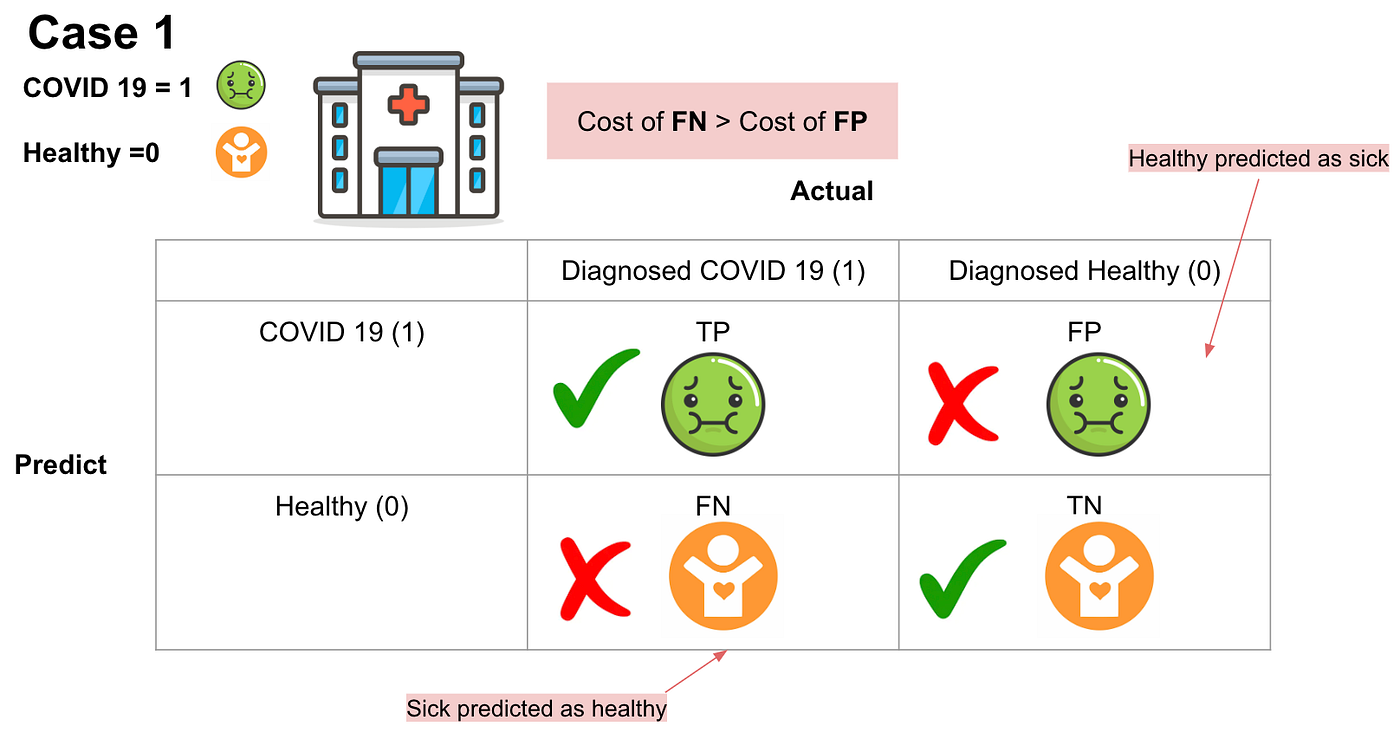
- the result of TP will be that the COVID 19 residents diagnosed with COVID-19.
- the result of TN will be that healthy residents are with good health.
- the result of FP will be that those actually healthy residents are predicted as COVID 19 residents.
- the result of FN will be that those actual COVID 19 residents are predicted as the healthy residents
In case 1, which scenario do you think will have the highest cost?
Imagine that if we predict COVID-19 residents as healthy patients and they do not need to quarantine, there would be a massive number of COVID-19 infections. The cost of false negatives is much higher than the cost of false positives.
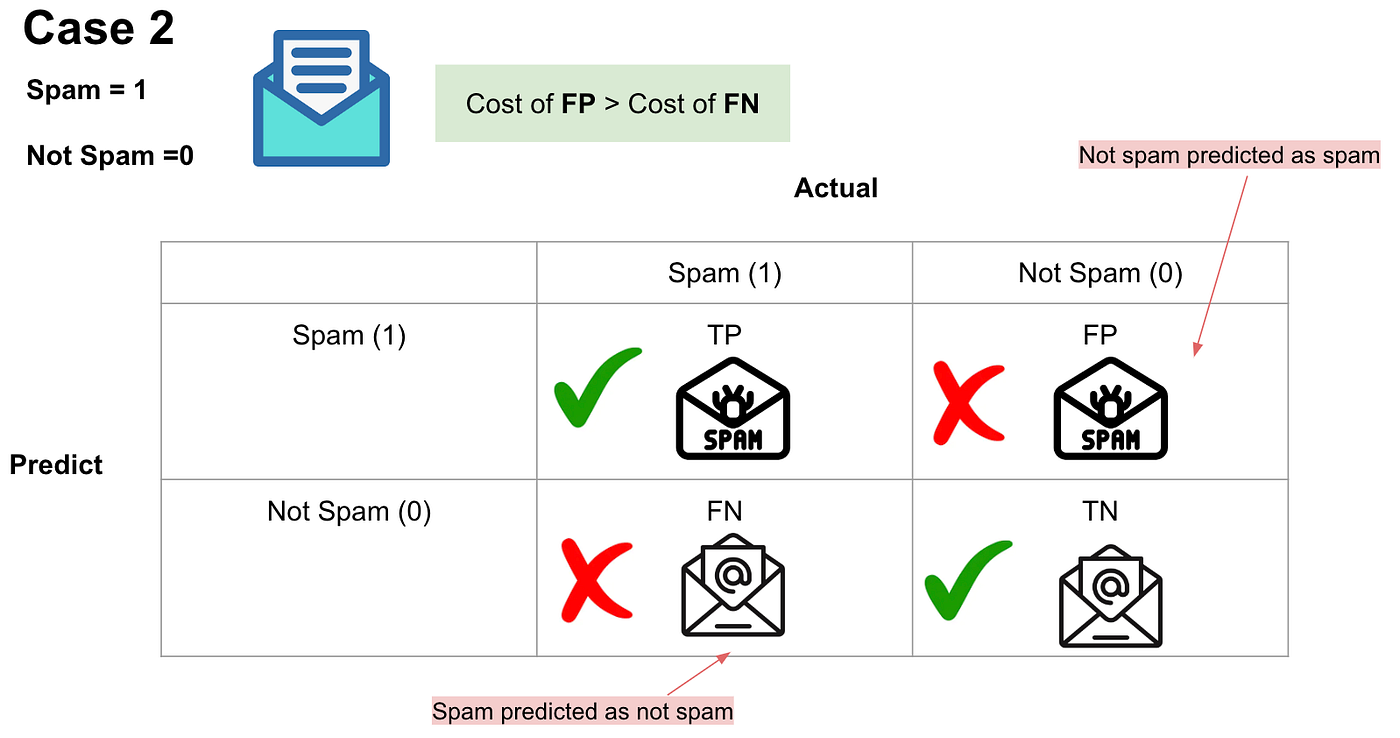
- the result of TP will be that spam emails are placed in the spam folder.
- the result of TN will be that important emails are received.
- the result of FP will be that important emails are placed in the spam folder.
- the result of FN will be that spam emails are received.
In case 2, which scenario do you think will have the highest cost?
Well, since missing important emails will clearly be more of a problem than receiving spam, we can say that in this case, FP will have a higher cost than FN.
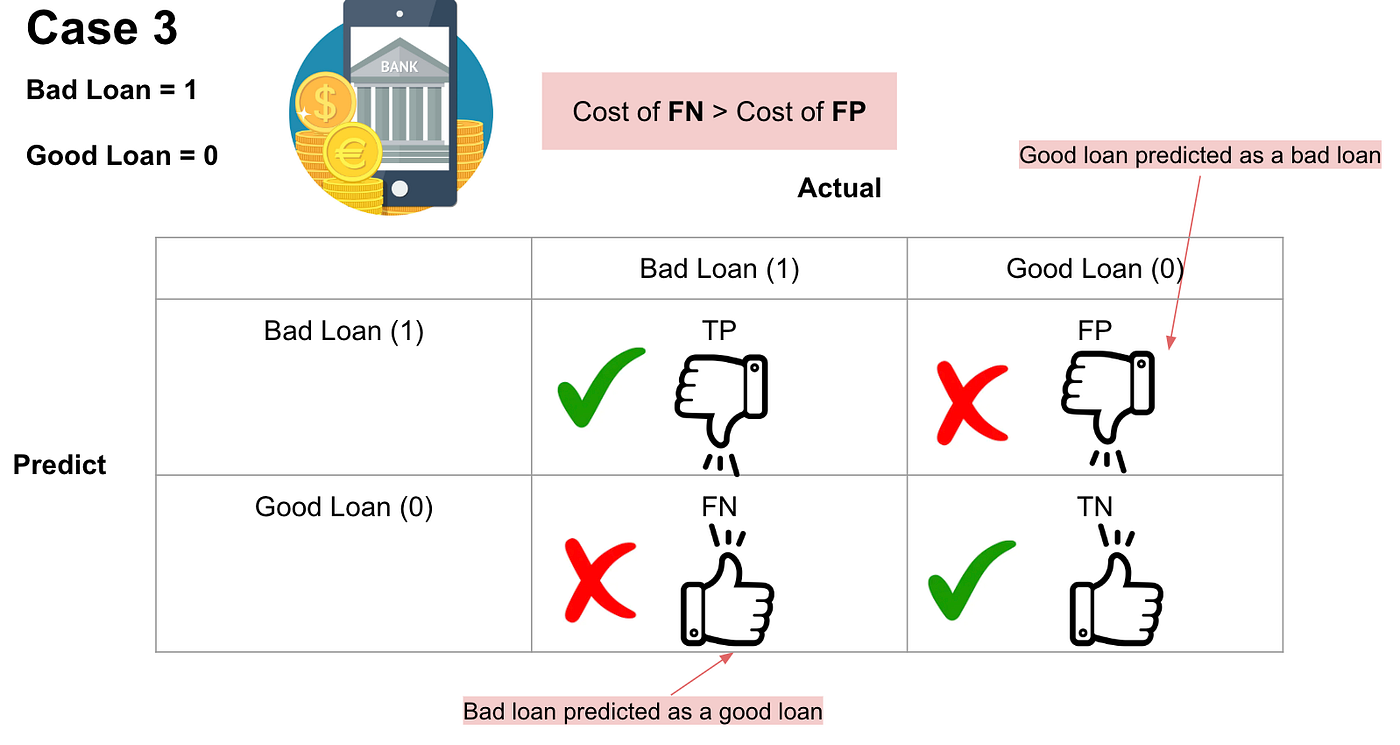
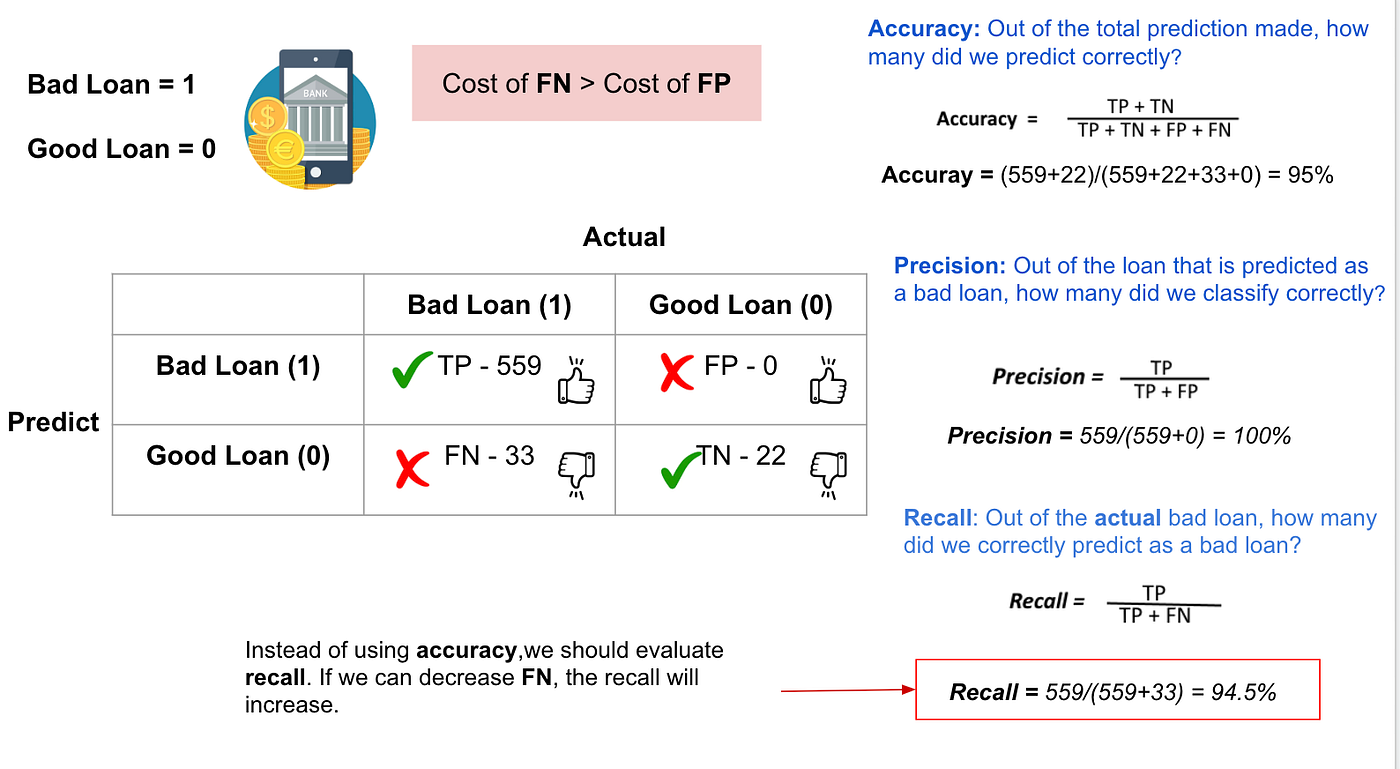
- the result of TP will be that bad loans are correctly predicted as bad loans.
- the result of TN will be that good loans are correctly predicted as good loans.
- the result of FP will be that (actual) good loans are incorrectly predicted as bad loans.
- the result of FN will be that (actual) bad loans are incorrectly predicted as good loans.
In case 3, which scenario do you think will have the highest cost?
The banks would lose a bunch amount of money if the actual bad loans are predicted as good loans due to loans not being repaid. On the other hand, banks won't be able to make more revenue if the actual good loans are predicted as bad loans. Therefore, the cost of False Negatives is much higher than the cost of False Positives. Imagine that.
Summary
In practice, the cost of false negatives is not the same as the cost of false positives, depending on the different specific cases. It is evident that not only should we calculate accuracy, but we should also evaluate our model using other metrics, for example, Recall and Precision.
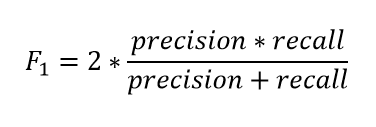
Combining Precision and Recall
In the above three cases, we want to maximize either recall or precision at the expense of the other metric. For example, in the case of a good or bad loan classification, we would like to decrease FN to increase recall. However, in cases where we want to find an optimal blend of precision and recall, we can combine the two metrics using the F1 score.
F-Measure provides a single score that balances both the concerns of precision and recall in one number. A good F1 score means that you have low false positives and low false negatives, so you’re correctly identifying real threats, and you are not disturbed by false alarms. An F1 score is considered perfect when it’s 1, while the model is a total failure when it’s 0.
Decision Threshold
ROC is a major visualization technique for presenting the performance of a classification model. It summarizes the trade-off between the true positive rate (tpr) and false positive rate (fpr) for a predictive model using different probability thresholds.
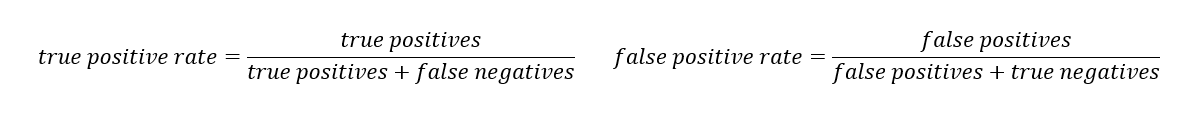
The equation of tpr and fpr.
The true positive rate (tpr) is the recall and the false positive rate (FPR) is the probability of a false alarm.
A ROC curve plots the true positive rate (tpr) versus the false positive rate (fpr) as a function of the model’s threshold for classifying a positive. Given that c is a constant known as decision threshold, the below ROC curve suggests that by default c=0.5, when c=0.2, both tpr and fpr increase. When c=0.8, both tpr and fpr decrease. In general, tpr and fpr increase as c decrease. In the extreme case when c=1, all cases are predicted as negative; tpr=fpr=0. On the other hand, when c=0, all cases are predicted as positive; tpr=fpr=1.
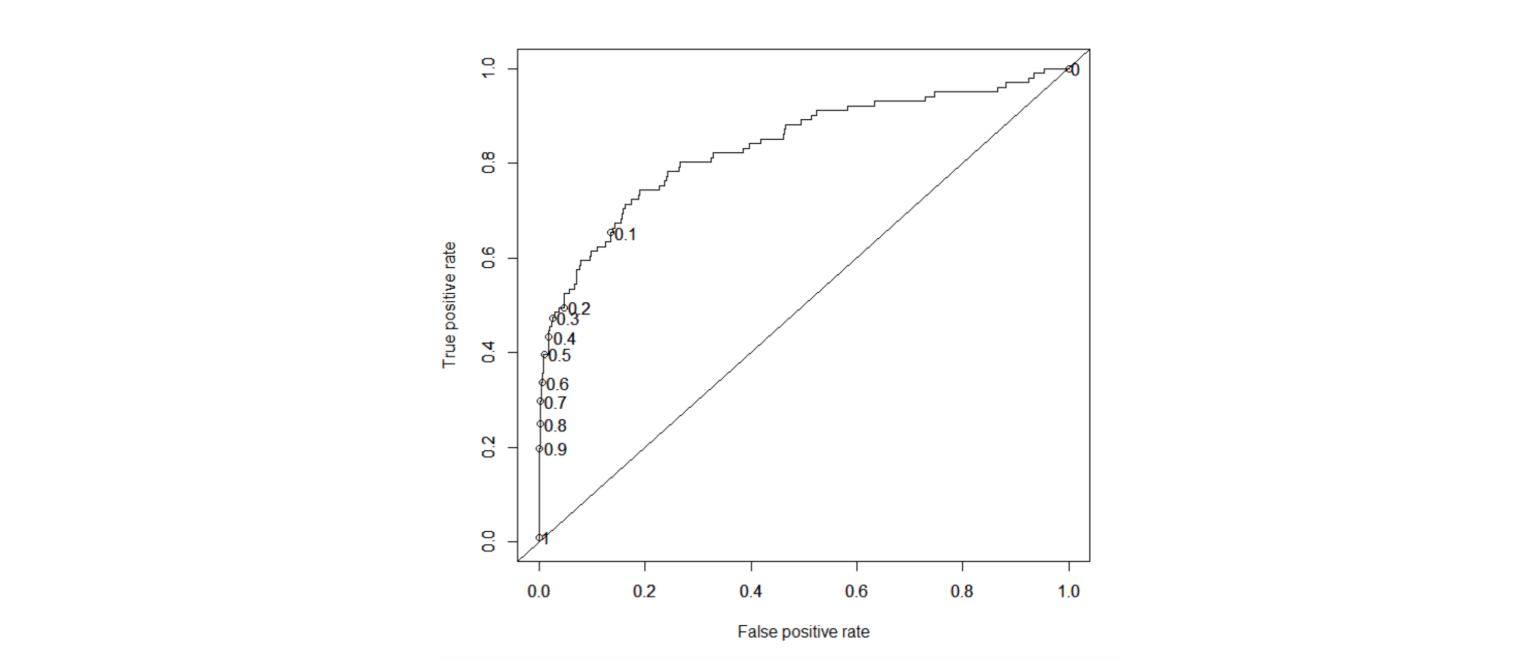
ROC chart.
Finally, we can assess the performance of the model by the area under the ROC curve (AUC). As a rule of thumb, 0.9–1=excellent; 0.8-.09=good; 0.7–0.8=fair; 0.6–0.7=poor; 0.50–0.6=fail.
Summary
- The Confusion Matrix for a 2-class classification problem
- The key classification metrics: Accuracy, Recall, Precision, and F1- Score
- The difference between Recall and Precision in specific cases
- Decision Thresholds and Receiver Operating Characteristic (ROC) curve
Clare Liu is a Data Scientist at Fintech (bank) industry, based in HK. Passionate in resolving mystery about data science and machine learning. Join me on the self-learning journey.