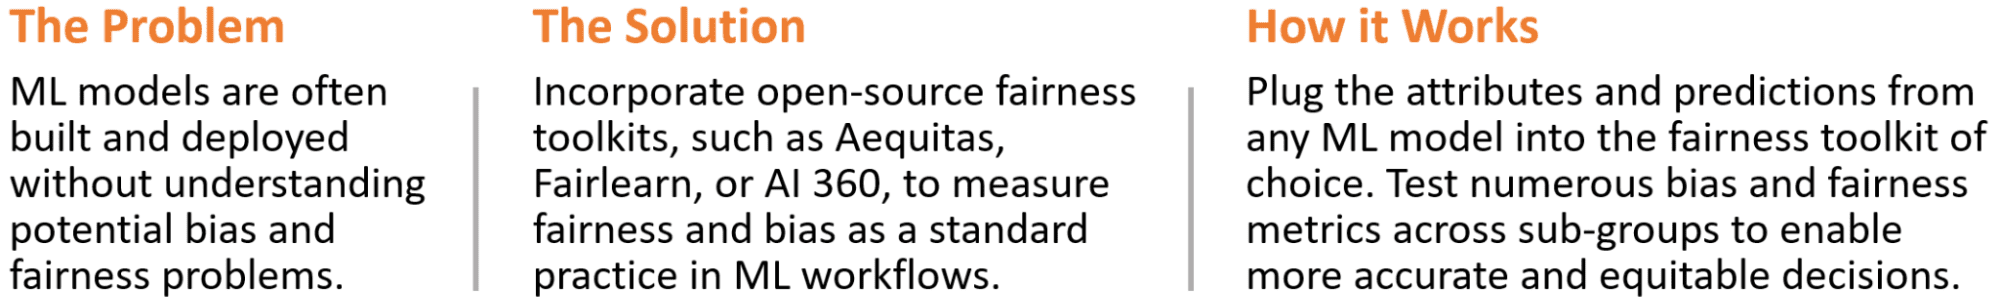
The Fast and Effective Way to Audit ML for Fairness
Is your model fair? Here's how to audit using the Aequitas Toolkit.

Ruth Bader Ginsburg on the Difficulty of Getting at Unconscious Bias in our Courts (1)
Introduction
The Notorious RBG is right. It’s hard to get at unconscious bias in our legal system. However, unlike the supreme court, we data scientists have new open-source toolkits that make it easy to audit our machine-learning models for bias and fairness. If Waylan Jennings and Willie Nelson had it to do over today, I like to think their famous duet might go something more like this:
♪Mammas don't let your babies grow up to be Supreme Court Justices♪
♪Let ‘em be analysts and data scientists and such♪
♪There ain't no Python library to make the law fairer♪
♪So it's easier to be a data scientist than a justice out there♪ (2)
The Aequitas Fairness and Bias Toolkit (3) is an example of one of these Python libraries. I decided to take it for a test drive using one of the most popular data sets available. You are probably already familiar with the Titanic data used in the Kaggle beginners tutorial. This challenge is to predict passenger survival on the Titanic. I built a no frills Random Forest Classifier model using this data and fed it into the Aequitas toolkit.
After only nine additional lines of code, I was ready to see if my initial model is fair to children. I was stunned by the results. My initial model hates children. It is reasonably accurate when predicting an adult will survive. But 2.9 times more likely to be wrong when predicting a child will survive. In the statistical parlance of data science, the false positive rate is 2.9 times higher for children than adults. It is a significant disparity in fairness. Worse yet my initial model also disadvantages females and passengers from the lower socio-economic class when predicting survival.
The Article in a Nutshell
Do you know if your ML models are fair? If you don’t, you should! This article will demonstrate how to easily audit any supervised learning model for fairness using the open source Aequitas toolkit. We will also comment on the much tougher task of improving fairness in your model.
This project is coded in Python using Google Colaboratory. The complete code base is available on my Titanic-Fairness GitHub page. Here is the workflow at a high level:
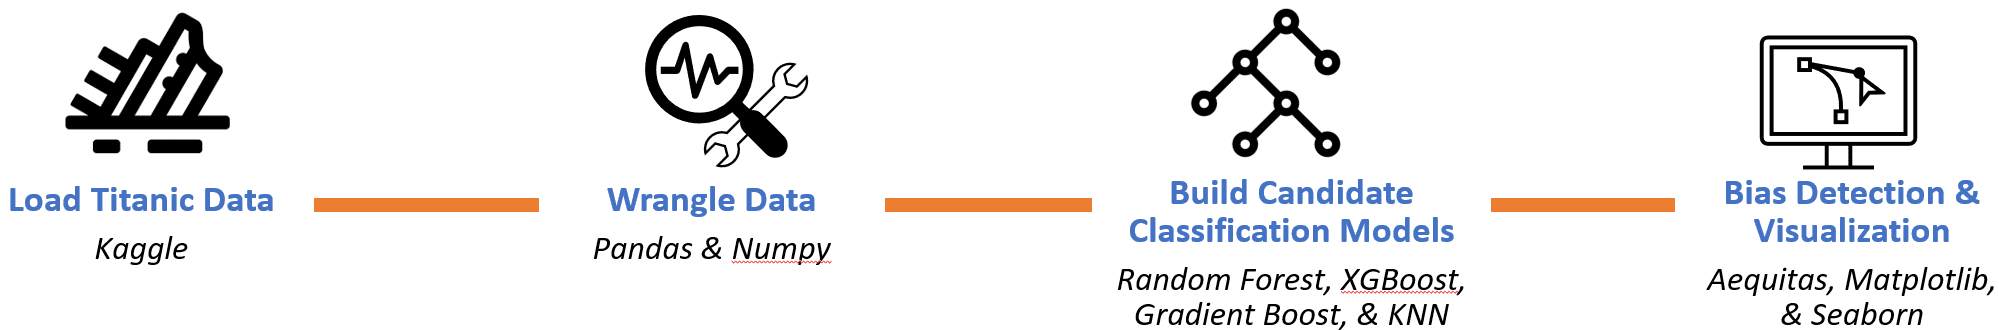
Analytics Workflow
Step 1: Format Input Data
Let's start at the end. Once the work of building a model is complete we have everything we need to format the input data frame for the Aequitas toolkit. The input data frame is required to contain columns labeled ‘score’ and ‘label_value’ as well as at least one attribute to measure fairness against. Here is the input table for our Random Forest model after formatting.
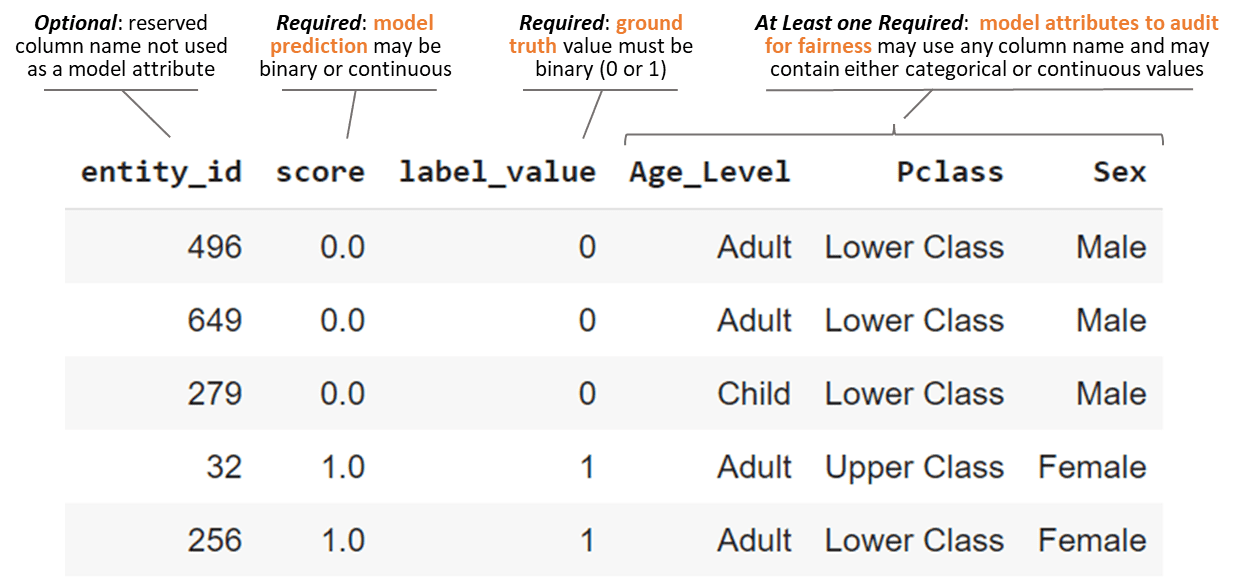
Initial Titanic Survival ML Model formatted as Aequitas Input Data
The predictions for our model in the ‘score’ column are binary as either 1 for survival or 0 for not. The ‘score’ values may also be a probability between 0 and 1 as in a logistic regression model. In this case threshold(s) must be defined as described in the configuration documentation.
We used ‘age’ from the original data set to engineer a categorical attribute separating each passenger as either an ‘Adult’ or a ‘Child’. Aequitas will also accept continuous data. If we provide ‘age’ as a continuous variable, as it exists in the original data set, then Aequitas will automatically transform it into four categories based on quartiles.
Step 2: Define Model Fairness
Defining fairness is hard. There are many measures of bias and fairness. Also, perspective often varies depending on which sub-group it is coming from. How do we decide what to care about? The Aequitas team provides a fairness decision tree that can help. It is built around understanding either the assistive, or punitive, impact of the associated interventions. Fairlearn is another toolkit. The Fairlearn documentation provides an excellent framework to perform a fairness assessment.
Fairness is dependent on the specifics of the use case. So we will need to define a contrived use case for the Kaggle Titanic data set. To do that, please suspend reality, go back in time, and imagine that after the wreckage of the Atlantic in 1873, the Republic in 1909, and the Titanic in 1912, the White Star Line has consulted with us. We are to build a model to predict survival in the event of another major catastrophe at sea. We will provide a prediction for each prospective passenger of the HMHS Britannic, the company's third and final Olympic class of steamship.

Britannic Postcard from 1914 (4)
Thinking through our contrived case example, our model is punitive when we incorrectly predict survival for a prospective passenger. They might be gravely over confident in the event the Britannic has a mishap at sea. This type of model error is a false positive.
Now let's consider the demographics of our passengers. Our data set includes labels for sex, age, and socio-economic class. We will evaluate each group for fairness. But let's start with children as our primary fairness objective.
Now we need to translate our objective into terms that are compatible with Aequitas. We can define our model fairness objective as minimizing disparity in the false positive rate (fpr) of children versus adults (reference group). Disparity is simply the ratio of the false positive rate for children to that of the reference group. We will also define a policy tolerance that the disparity across groups can be no more than 30%.
Step 3: Utilize the Aequitas Toolkit
Finally we end at the start. To begin our audit we need to install Aequitas, import the necessary libraries, and initialize the Aequitas classes. Here is the Python code to do that:

Install Aequitas and Initialize
The Group( ) class is used to hold confusion matrix calculations and related metrics for each subgroup. Things like false positive count, true positive count, group size, etc. for each subgroup of children, adults, females, and so on. And the Bias( ) class is used to hold disparity calculations between groups. For example the ratio of the false positive rate for children to the false positive rate of the reference group (adults).
Next we specify that we want to audit the ‘Age_Level’ attribute and use ‘Adult’ as the reference group. This is a Python dictionary and it may include more than a single entry.

Specify ‘Age_Level’ as the Attribute to Evaluate for Fairness
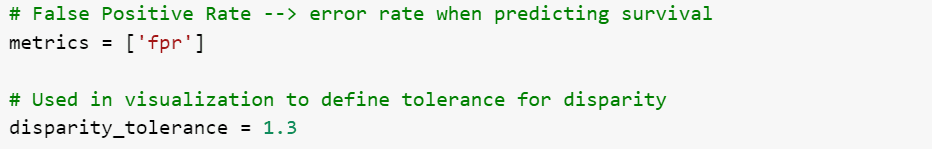
The last two things to specify are the metrics we wish to visualize and our tolerance for disparity. We are interested in false positive rates (fpr). The tolerance is used as a reference in the visualization.
Specify Fairness Metrics and Tolerance
Now we call the get_crosstabs( ) method using our previously formatted input data frame (dfAequitas) and setting the attribute columns to the attributes_to_audit list we defined. The second line creates our bias dataframe (bdf) using the get_disparity_predefined_groups( ) method. And the third line plots the disparity metrics using Aequitas plot (ap).
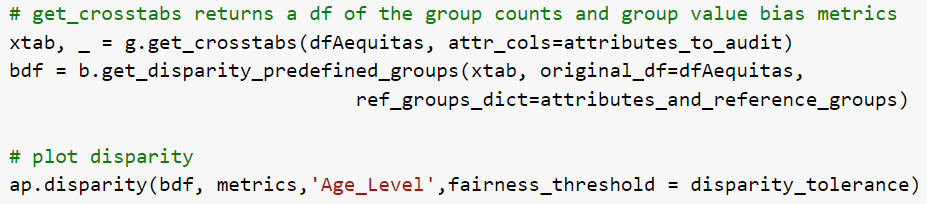
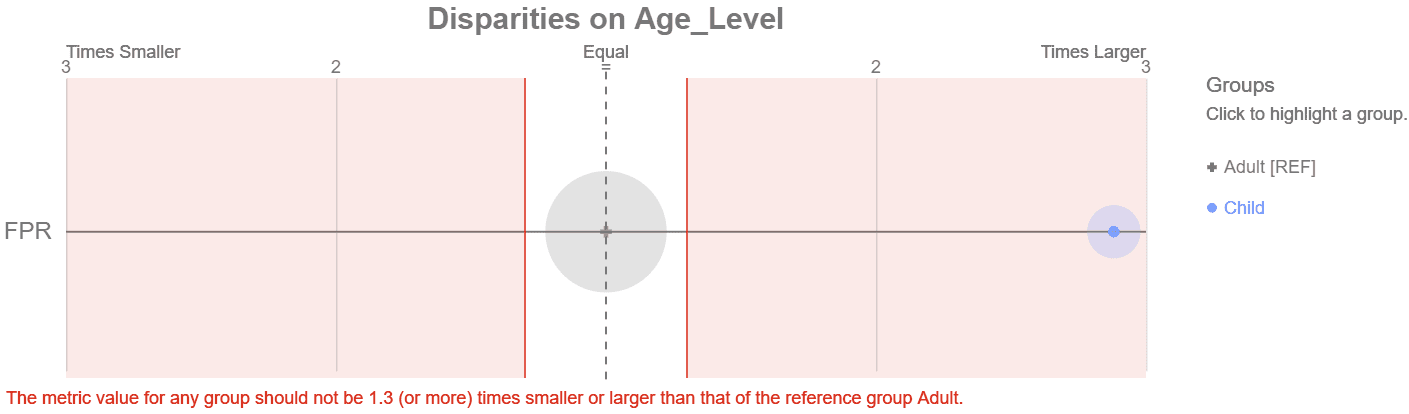
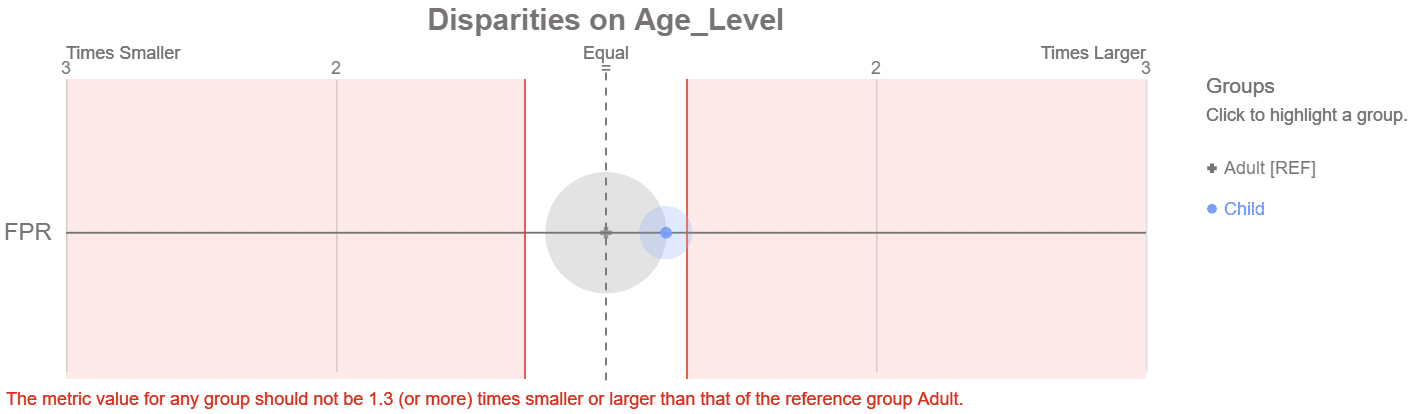
Aequitas Disparity Visualization with Cursor Rollover
Immediately we see that the subgroup of children are in the red, outside of our 30% tolerance for disparity. With six lines of code for setup/configuration and three more for creating the plot, we have a clear visualization of how our model performs against our fairness objective. Clicking on the group reveals there are 36 children in the test data with a false positive rate (fpr) of 17%. This is 2.88 times higher than the reference group. The pop-up for the reference group reveals 187 Adults with a false positive rate of 6%.
Step 4: Mitigate Model Bias
Improving model fairness can be significantly more challenging than identifying it. But there is a growing amount of serious research on this topic. Below is a table, adapted from the Aequitas documentation, that summarizes how to improve model fairness.
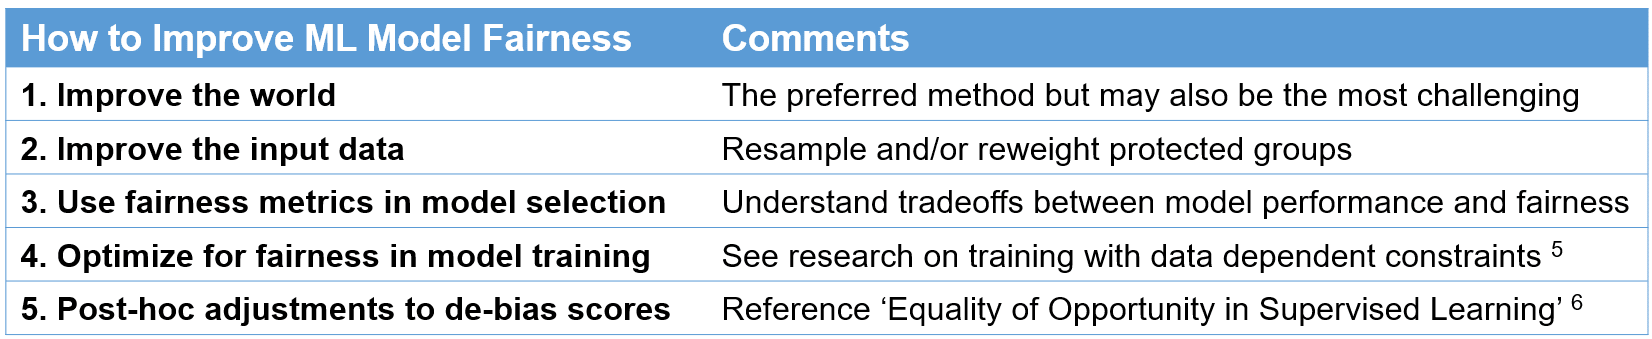
Adapted from Aequitas Documentation (5,6)
When working to improve input data, a common mistake is to think a model can’t be biased if it doesn’t even have data on age, race, gender, or other demographics. This is a fallacy. ‘There is no fairness through unawareness. A demographic blind model can discriminate.’ (7) Do NOT remove sensitive attributes from your model without considering the impact. This will preclude the ability to audit for fairness and it may make the bias worse.
There are toolkits available that can help mitigate bias in ML models. Two of the most prominent are AI Fairness 360 by IBM and Fairlearn by Microsoft. These are robust and well documented open source toolkits. When using, be mindful of the resulting tradeoffs with model performance.
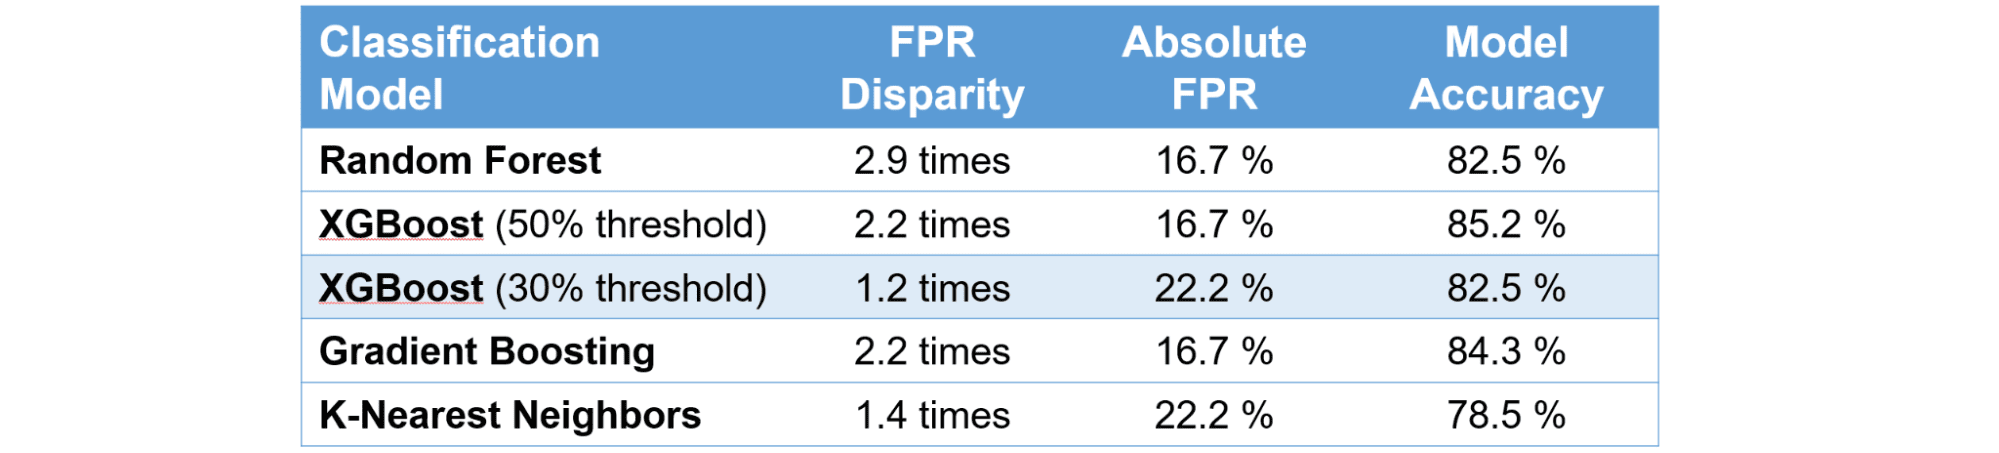
For our example, we will mitigate bias with the third bullet by using fairness metrics in our model selection. So we built a few more classification models in our search for fairness. The following table summarizes our metrics for each candidate model. Recall that our initial model is the Random Forest Classification.
Classification Model Fairness Metrics for Children compared with Adults
And here is the Aequitas plot for the highlighted 30% threshold XGBoost model which meets our fairness objective.
XGBoost with 30% Threshold Meets our Fairness Objective
Success? The group of children are out of the red shaded area. But is this really the best model? Lets compare the two XGBoost models. These models both predict a continuous probability of survival from 0 to 100%. A threshold value is then used to convert the probability to a binary output of 1 for survival or 0 for not. The default is 50%. When we lower the threshold to 30% the model predicts more passengers to survive. For example, a passenger with a 35% probability meets the new threshold and the prediction is now ‘survival.’ This also creates more false positive errors. In our test data, moving the threshold to 30% adds 13 more false positives to the larger reference group containing adults and only 1 more false positive to the group of children. This makes them close to parity.
So the 30% XGBoost model is meeting our fairness objective in a way that is not preferable. Instead of raising the model performance for our protected group, we lowered the performance of the reference group to achieve parity within our tolerance. This is not a desirable solution but is representative of the difficult tradeoffs in a real world use case.
Bonus Section - More Examples of Aequitas Visualizations
The disparity tolerance plot is only one example of the built in Aequitas visualizations. This section will demonstrate other options. All of the following data is associated with our initial Random Forest model. The code to produce each of the examples is also included on my Titanic-Fairness GitHub page.
The first example is a Treemap of disparity in false positive rates across all of the attributes.
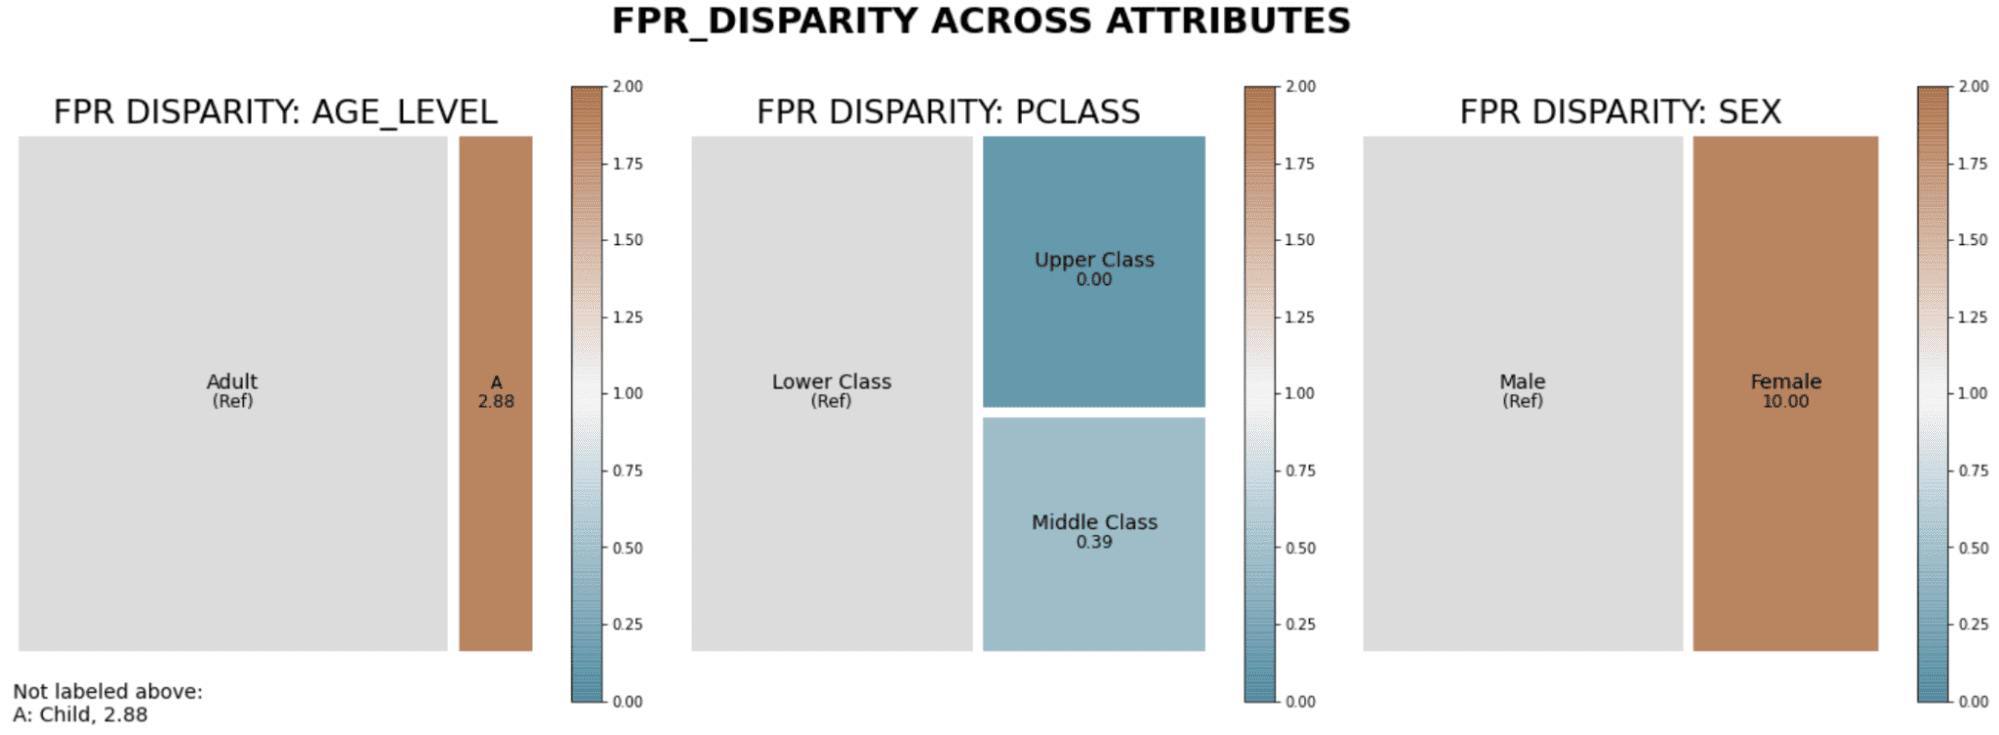
Treemap of Disparity in False Positive Rates across All Attributes
The relative size of each group is provided by the area. The darker the color the larger the disparity. Brown means a higher false positive rate than the reference and teal means lower. The reference group is automatically selected as the group with the largest population. So the above chart, from left to right, is interpreted as:
- Children have a much higher false positive rate than Adults,
- Upper Class Passengers have a much lower false positive rate than Lower Class, and
- Females have a much higher false positive rate than males.
More concisely, the treemap indicates our initial model is unfair to Children, Lower Class Passengers, and Females. The next plot shows similar information as a more traditional bar chart. But in this example we see the absolute false positive rate instead of the disparity (or ratio) with the reference group.
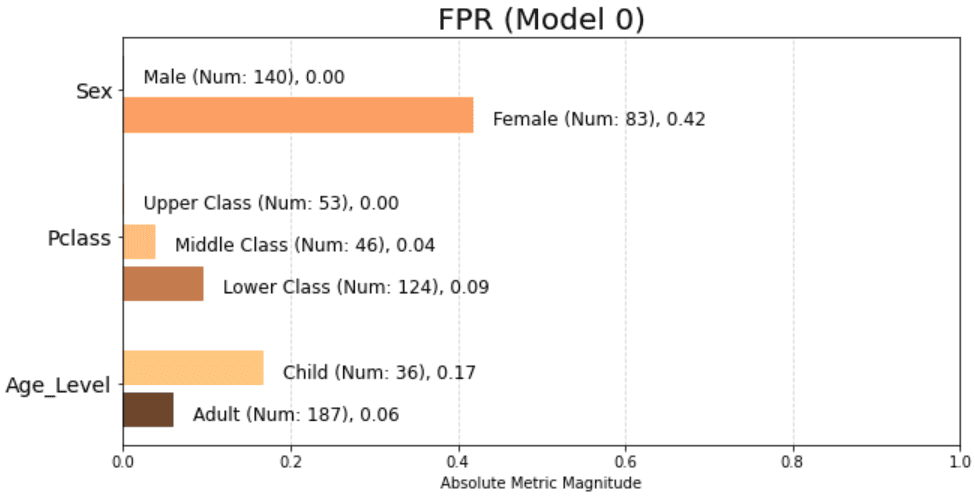
Bar Chart of False Positive Rates as Absolute Values across All Attributes
This bar chart points out a large problem with females having a 42% false positive rate. We can produce a similar bar chart plots for any of the following metrics:
- Predicted Positive Group Rate Disparity (pprev),
- Predicted Positive Rate Disparity (ppr),
- False Discovery Rate (fdr),
- False Omission Rate (for),
- False Positive Rate (fpr), and
- False Negative Rate (fnr).
And finally, there are also methods to print the raw data used in the charts. Below is an example of the basic counts for each group from the initial Random Forest model.
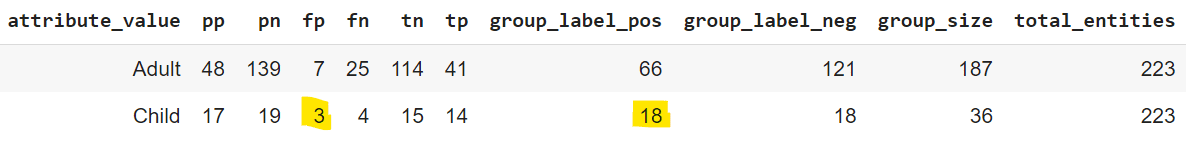
Table of Raw Counts for Confusion Matrix by Group
As highlighted above, there are 3 children scored as false positives out of 18 total who were predicted to survive. 3 divided by 18 gives us a 17% false positive rate. The next table provides these metrics as percentages. In the below table, notice the highlighted false positive rate for children is 17% as expected.
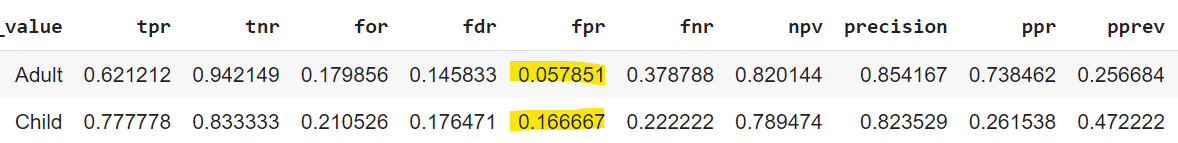
Confusion Matrix Table Expressed as Percentages by Group
The ratio of the false positive rate of children to adults is 2.88 calculated from the highlights above as 0.167 divided by 0.0579. This is the disparity for children relative to the reference group. Aequitas provides a method to directly print all of the disparity values.
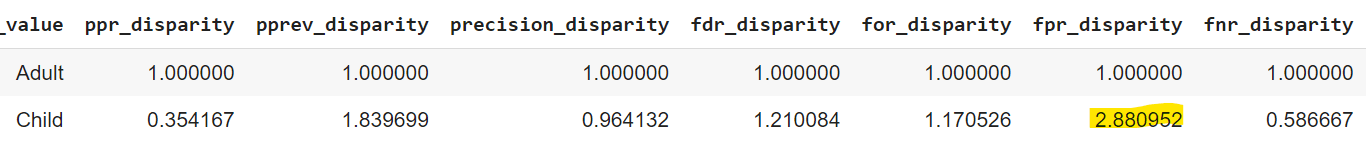
Table of Raw Counts for Confusion Matrix by Group
Conclusion
The importance of fairness in machine learning is self-evident when we are working in public policy or credit decisioning. Even if not working in these areas, it makes sense to incorporate a fairness audit into your base machine learning workflow. For example, it may be useful to know if your models are disadvantageous to your biggest, most profitable, or longest tenure customers. Fairness audits are easy to do and will provide insights into the areas where your model both over, and under, performs.
One last tip: fairness audits should also be incorporated into due diligence efforts. If acquiring a company with machine learning models then perform a fairness audit. All that is required is test data with the predictions and attribute labels from those models. This helps understand the risk that the models might be discriminating against a particular group, which could lead to legal issues or reputational damage.
Reference
- Parody of original song lyrics by Waylon Jennings & Willie Nelson
- Britannic postcard image from the public domain site wikimedia originally published on ibiblio.org by Frederic Logghe. Link: https://commons.wikimedia.org/wiki/File:Britannic_postcard.jpg
- Pedro Saleiro, Benedict Kuester, Loren Hinkson, Jesse London, Abby Stevens, Ari Anisfeld, Kit T. Rodolfa, Rayid Ghani, ‘Aequitas: A Bias and Fairness Audit Toolkit’ Link: https://arxiv.org/abs/1811.05577
- Britannic postcard image from the public domain site wikimedia originally published on ibiblio.org by Frederic Logghe. Link: https://commons.wikimedia.org/wiki/File:Britannic_postcard.jpg
- Muhammad Bilal Zafar, Isabel Valera, Manuel Gomez Rodriguez, Krishna P. Gummadi, ’Fairness Constraints: Mechanisms for Fair Classification’ Link: http://proceedings.mlr.press/v54/zafar17a/zafar17a.pdf
- Hardt, Moritz and Price, Eric and Srebro, Nathan, ‘Equality of Opportunity in Supervised Learning’ Link: https://arxiv.org/abs/1610.02413
- Rayid Ghani, Kit T Rodolfa, Pedro Saleiro, ‘Dealing with Bias and Fairness in AI/ML/Data Science Systems’ Slide 65. Link: https://dssg.github.io/aequitas/examples/compas_demo.html#Putting-Aequitas-to-the-task
Matt Semrad is analytics leader with 20+ years of experience building organizational capabilities in high growth technology companies.