Learning from Imbalanced Classes
Imbalanced classes can cause trouble for classification. Not all hope is lost, however. Check out this article for methods in which to deal with such a situation.
By Tom Fawcett, Silicon Valley Data Science.
If you’re fresh from a machine learning course, chances are most of the datasets you used were fairly easy. Among other things, when you built classifiers, the example classes werebalanced, meaning there were approximately the same number of examples of each class. Instructors usually employ cleaned up datasets so as to concentrate on teaching specific algorithms or techniques without getting distracted by other issues. Usually you’re shown examples like the figure below in two dimensions, with points representing examples and different colors (or shapes) of the points representing the class:
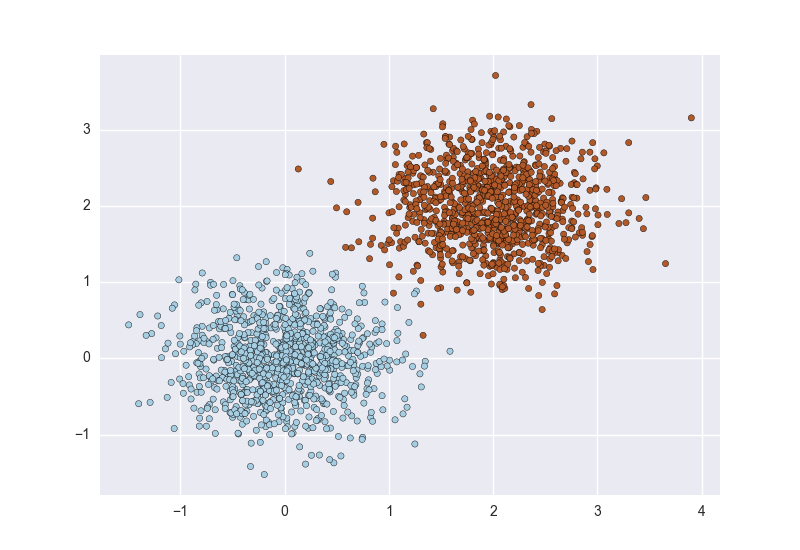
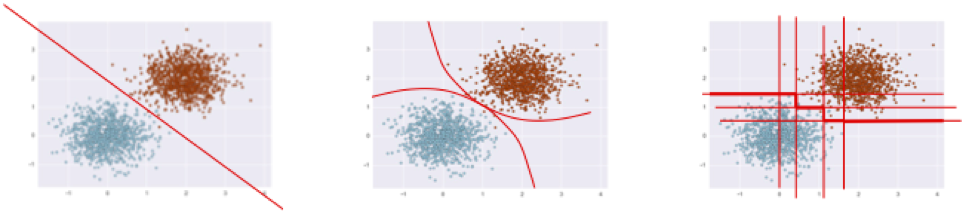
The goal of a classification algorithm is to attempt to learn a separator (classifier) that can distinguish the two. There are many ways of doing this, based on various mathematical, statistical, or geometric assumptions:
But when you start looking at real, uncleaned data one of the first things you notice is that it’s a lot noisier and imbalanced. Scatterplots of real data often look more like this:
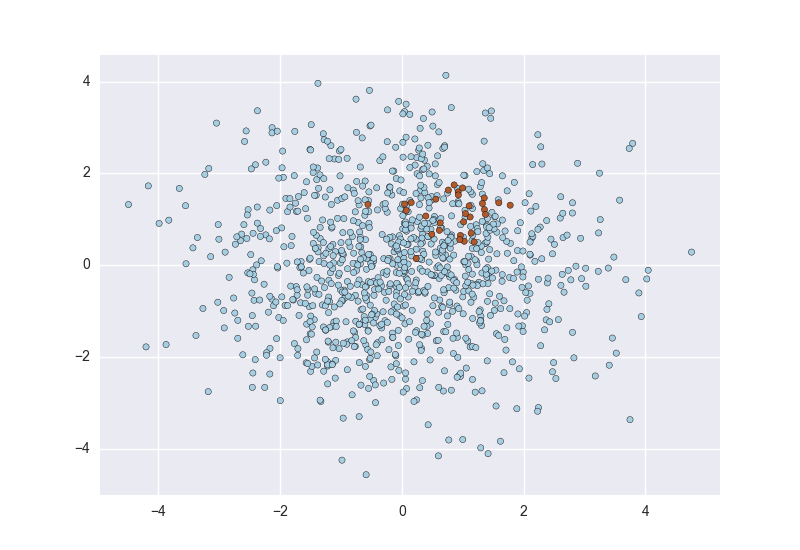
The primary problem is that these classes are imbalanced: the red points are greatly outnumbered by the blue.
Research on imbalanced classes often considers imbalanced to mean a minority class of 10% to 20%. In reality, datasets can get far more imbalanced than this. Here are some examples:
- About 2% of credit card accounts are defrauded per year1. (Most fraud detection domains are heavily imbalanced.)
- Medical screening for a condition is usually performed on a large population of people without the condition, to detect a small minority with it (e.g., HIV prevalence in the USA is ~0.4%).
- Disk drive failures are approximately ~1% per year.
- The conversion rates of online ads has been estimated to lie between 10-3 to 10-6.
- Factory production defect rates typically run about 0.1%.
Many of these domains are imbalanced because they are what I call needle in a haystack problems, where machine learning classifiers are used to sort through huge populations of negative (uninteresting) cases to find the small number of positive (interesting, alarm-worthy) cases.
When you encounter such problems, you’re bound to have difficulties solving them with standard algorithms. Conventional algorithms are often biased towards the majority class because their loss functions attempt to optimize quantities such as error rate, not taking the data distribution into consideration2. In the worst case, minority examples are treated as outliers of the majority class and ignored. The learning algorithm simply generates a trivial classifier that classifies every example as the majority class.
This might seem like pathological behavior but it really isn’t. Indeed, if your goal is to maximize simple accuracy (or, equivalently, minimize error rate), this is a perfectly acceptable solution. But if we assume that the rare class examples are much more important to classify, then we have to be more careful and more sophisticated about attacking the problem.
If you deal with such problems and want practical advice on how to address them, read on.
Note: The point of this blog post is to give insight and concrete advice on how to tackle such problems. However, this is not a coding tutorial that takes you line by line through code. I have Jupyter Notebooks (also linked at the end of the post) useful for experimenting with these ideas, but this blog post will explain some of the fundamental ideas and principles.
Handling imbalanced data
Learning from imbalanced data has been studied actively for about two decades in machine learning. It’s been the subject of many papers, workshops, special sessions, and dissertations (a recent survey has about 220 references). A vast number of techniques have been tried, with varying results and few clear answers. Data scientists facing this problem for the first time often ask What should I do when my data is imbalanced? This has no definite answer for the same reason that the general question Which learning algorithm is best? has no definite answer: it depends on the data.
That said, here is a rough outline of useful approaches. These are listed approximately in order of effort:
- Do nothing. Sometimes you get lucky and nothing needs to be done. You can train on the so-called natural (or stratified) distribution and sometimes it works without need for modification.
- Balance the training set in some way:
- Oversample the minority class.
- Undersample the majority class.
- Synthesize new minority classes.
- Throw away minority examples and switch to an anomaly detection framework.
- At the algorithm level, or after it:
- Adjust the class weight (misclassification costs).
- Adjust the decision threshold.
- Modify an existing algorithm to be more sensitive to rare classes.
- Construct an entirely new algorithm to perform well on imbalanced data.
Digression: evaluation dos and don’ts
First, a quick detour. Before talking about how to train a classifier well with imbalanced data, we have to discuss how to evaluate one properly. This cannot be overemphasized. You can only make progress if you’re measuring the right thing.
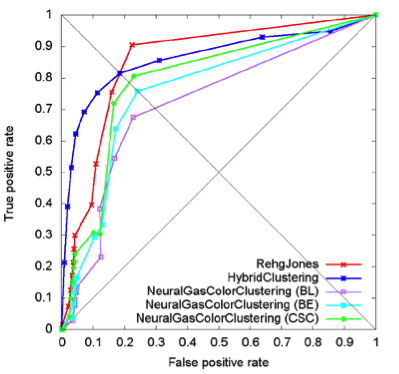
- Don’t use accuracy (or error rate) to evaluate your classifier! There are two significant problems with it. Accuracy applies a naive 0.50 threshold to decide between classes, and this is usually wrong when the classes are imbalanced. Second, classification accuracy is based on a simple count of the errors, and you should know more than this. You should know which classes are being confused and where (top end of scores, bottom end, throughout?). If you don’t understand these points, it might be helpful to read The Basics of Classifier Evaluation, Part 2. You should be visualizing classifier performance using a ROC curve, a precision-recall curve, a lift curve, or a profit (gain) curve.

ROC curve
Precision-recall curve - Don’t get hard classifications (labels) from your classifier (via
scoresup>3 orpredict). Instead, get probability estimates viaprobaorpredict_proba. - When you get probability estimates, don’t blindly use a 0.50 decision threshold to separate classes. Look at performance curves and decide for yourself what threshold to use (see next section for more on this). Many errors were made in early papers because researchers naively used 0.5 as a cut-off.
- No matter what you do for training, always test on the natural (stratified) distribution your classifier is going to operate upon. See
sklearn.cross_validation.StratifiedKFold. - You can get by without probability estimates, but if you need them, use calibration (see
sklearn.calibration.CalibratedClassifierCV)

The two-dimensional graphs in the first bullet above are always more informative than a single number, but if you need a single-number metric, one of these is preferable to accuracy:
- The Area Under the ROC curve (AUC) is a good general statistic. It is equal to the probability that a random positive example will be ranked above a random negative example.
- The F1 Score is the harmonic mean of precision and recall. It is commonly used in text processing when an aggregate measure is sought.
- Cohen’s Kappa is an evaluation statistic that takes into account how much agreement would be expected by chance.