K-Means in Real Life: Clustering Workout Sessions
By using the within-cluster sum of squares as cost function, data points in the same cluster will be similar to each other, whereas data points in different clusters will have a lower level of similarity.
By Carolina Bento, Manager, Product Analytics
K-means clustering is a very popular unsupervised learning algorithm. In this article I want to provide a bit of background about it, and show how we could use it in an anecdotal real-life situation.
K-Means Clustering is an algorithm that, given a dataset, will identify which data points belong to each one of the k clusters. It takes your data and learns how it can be grouped.
Through a series of iterations, the algorithm creates groups of data points — referred to as clusters — that have similar variance and that minimize a specific cost function: the within-cluster sum of squares.
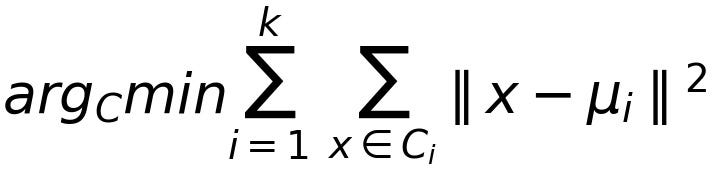
Within-Cluster Sum of Squares: where C_i is a cluster and "mu_i" is the mean of the data points in cluster C_i
By using the within-cluster sum of squares as cost function, data points in the same cluster will be similar to each other, whereas data points in different clusters will have a lower level of similarity.
K-Means Clustering is part of a group of learning algorithms called unsupervised learning. In this type of learning model, there is no explicit identification of a label/class/category for each data point.
Each data point in your dataset is a vector of attributes, i.e., features without a specific label that could assign it to a specific cluster or class. The algorithm will then learn on its own how to group data points that have similar features and cluster them together.
One important detail about K-Means Clustering is that, even though it identifies which data point should part of which cluster, you'll have to specify the parameter K, representing the total number of clusters that you want to use to "distribute" your data.
Your preferred workout is jogging and, since you're extremely data-inclined, you make sure to keep track of your performance. So you end up compiling a dataset similar to this
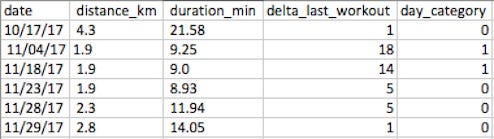
It consists of the date you went jogging, the total distance run (Km), duration (Min) and the number of days since your last workout. Each row in your dataset contains the attributes or features of each workout session.
Ultimately, the question you want answer is: "How can I identify similar workout sessions?"
By identifying workout sessions that are similar to each other you can have a better understanding of your overall performance and get new ideas on how to improve.
A clustering algorithm like K-Means Clustering can help you group the data into distinct groups, guaranteeing that the data points in each group are similar to each other.
A good practice in Data Science & Analytics is to first have good understanding of your dataset before doing any analysis.
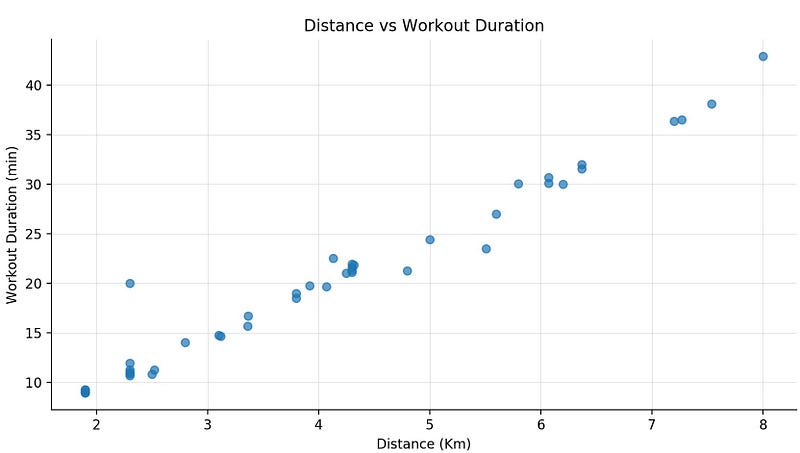
Taking an exploratory view of your dataset, you start by plotting a pair-plot, in order to get a better idea about the correlation between different features.
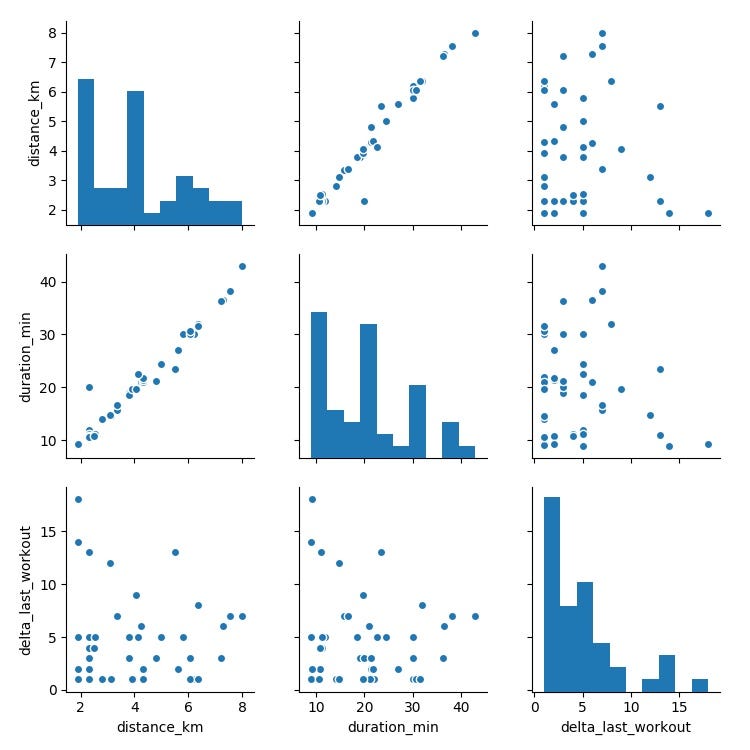
The plots on the diagonal correspond to the distribution of each feature, while the others are scatterplots of each pair of features.
One interesting plot is distance vs duration, which shows a linear correlation.
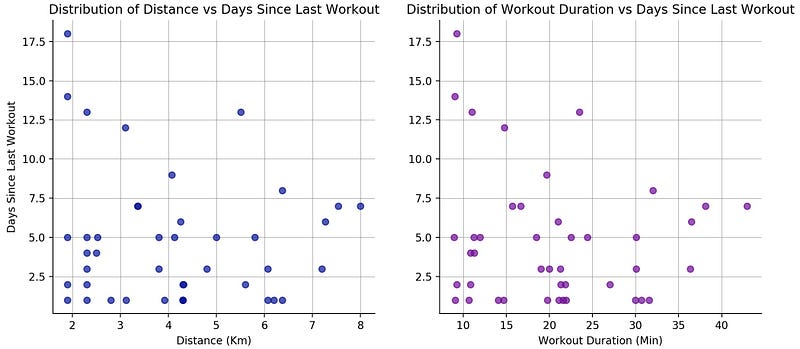
Whereas, when we compare distance and duration with the number of days since the last workout session, the is no evident correlation between them.
Now that you have a good idea of how your dataset looks like, it's time to use K-Means and see how the individual sessions are grouped. You can start off by splitting your dataset into two distinct groups.
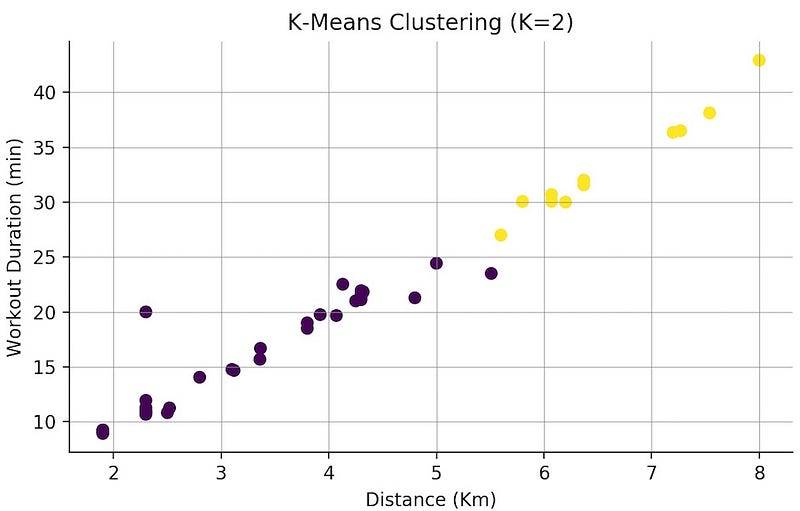
In this plot, like in the pair plot, we see the relationship between distance and workout duration, but now each data point has the colour of its cluster.
Taking a quick look at this scatter plot we can see that, for instance, all workouts under 25 minutes are in one cluster.
How do we know which K value to use?
Depending on the dataset and the problem you're solving, you may have an idea of how you want to cluster your data. Maybe you want to see the data clustered in 3 groups, 5 groups, 10 groups…
If that's not the case, how do we figure out which K value to use?
Like any parameter in an algorithm, it requires some experimentation, i.e., tuning.
In order to experiment with different values of K, you also need to have a deciding factor or metric, which you're going to be using to make a decision on which value of K provides the best results.
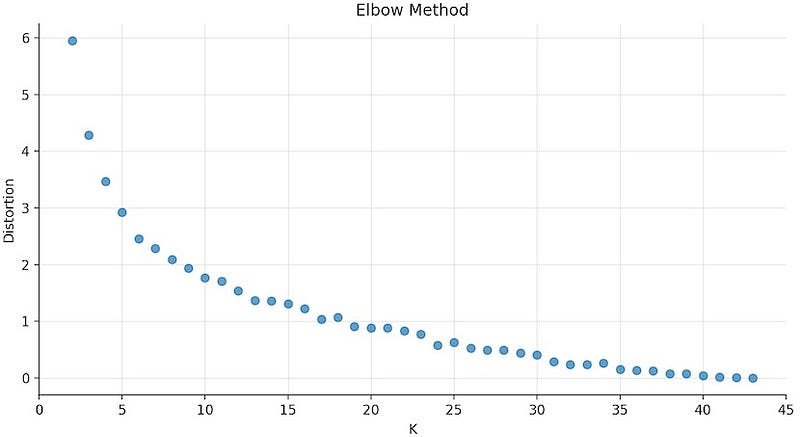
The plot above is the result of running K-Means Clustering on the workout dataset with values of K between 2 and 43, which corresponds to the size of the dataset. Each value of K is against the respective distortion value.
Distortion, on the y-axis, corresponds to our cost function: the sum of squared difference between each data point and the centroid, i.e., the cluster centre.
As K increases the corresponding distortion value will tend to zero, because you end up having just one data point per cluster. With only one data point in per cluster, the centroid is the data point itself, so the distortion will be equal to zero.
For this dataset, the the elbow of the curve is around K= 5. For values of K greater than 5, the distortion value starts decaying steadily.
Going back to the original dataset and re-running K-Means with the new found K, you can cluster the data into 5 different groups!
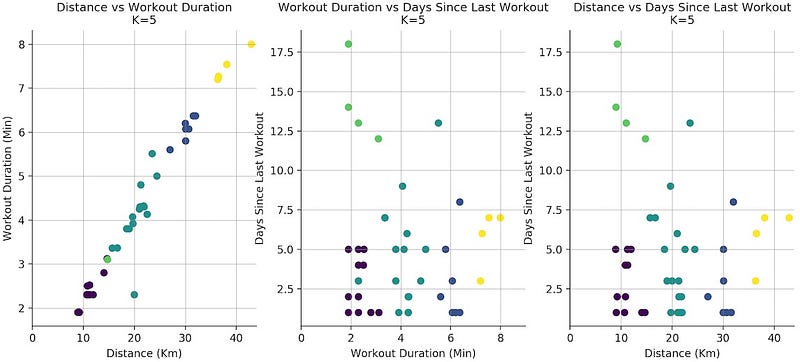
At this point, the job of K-Means Clustering is done and where your data analysis work begins ????????
The next step requires human intervention, in order to interpret the results and obtain additional insight.
Just to recap, these are the advantages of using K-Means:
- Easy to implement
- Relatively fast and efficient
- Only has one parameter to tune and you can easily see the direct impact of adjusting the value of parameter K
Thanks for reading!
If you enjoyed this article clap, clap, clap???????????? Share this with your friends, if you think they’d be interested!
Follow me on Twitter @carolinabento
Here are a few other articles I wrote that might also like
Bio: Carolina Bento Data analysis.Knowledge Visualization.Bookworm.Trying to live an efficient, productive life.Learning Vessel.
Original. Reposted with permission.
Related:
- Clustering Using K-means Algorithm
- Comparing Distance Measurements with Python and SciPy
- Toward Increased k-means Clustering Efficiency with the Naive Sharding Centroid Initialization Method