A complete guide to K-means clustering algorithm
Clustering - including K-means clustering - is an unsupervised learning technique used for data classification. We provide several examples to help further explain how it works.
By Diego Lopez Yse, Moody's Operations LATAM.

Photo by Ankush Minda on Unsplash
Let’s say you want to classify hundreds (or thousands) of documents based on their content and topics, or you wish to group together different images for some reason. Or what’s even more, let’s think you have that same data already classified but you want to challenge that labeling. You want to know if that data categorization makes sense or not, or can be improved.
Well, my advice is that you cluster your data. Information is often darkened by noise and redundancy, and grouping data into clusters (clustering) with similar features is an efficient way to bring some light on.
Clustering is a technique widely used to find groups of observations (called clusters) that share similar characteristics. This process is not driven by a specific purpose, which means you don’t have to specifically tell your algorithm how to group those observations since it does it on its own (groups are formed organically). The result is that observations (or data points) in the same group are more similar between them than other observations in another group. The goal is to obtain data points in the same group as similar as possible, and data points in different groups as dissimilar as possible.
Extremely well fitted for exploratory analysis, K-means is perfect for getting to know your data and providing insights on almost all datatypes. Whether it is an image, a figure or a piece of text, K-means is so flexible it can take almost everything.
One of the rockstars in unsupervised learning
Clustering (including K-means clustering) is an unsupervised learning technique used for data classification.
Unsupervised learning means there is no output variable to guide the learning process (no this or that, no right or wrong) and data is explored by algorithms to find patterns. We only observe the features but have no established measurements of the outcomes since we want to find them out.
As opposed to supervised learning where your existing data is already labeled and you know which behaviour you want to determine in the new data you obtain, unsupervised learning techniques don’t use labelled data and the algorithms are left to themselves to discover structures in the data.
Within the universe of clustering techniques, K-means is probably one of the mostly known and frequently used. K-means uses an iterative refinement method to produce its final clustering based on the number of clusters defined by the user (represented by the variable K) and the dataset. For example, if you set K equal to 3 then your dataset will be grouped in 3 clusters, if you set K equal to 4 you will group the data in 4 clusters, and so on.
K-means starts off with arbitrarily chosen data points as proposed means of the data groups, and iteratively recalculates new means in order to converge to a final clustering of the data points.
But how does the algorithm decide how to group the data if you are just providing a value (K)? When you define the value of K you are actually telling the algorithm how many means or centroids you want (if you set K=3 you create 3 means or centroids, which accounts for 3 clusters). A centroid is a data point that represents the center of the cluster (the mean), and it might not necessarily be a member of the dataset.
This is how the algorithm works:
- K centroids are created randomly (based on the predefined value of K)
- K-means allocates every data point in the dataset to the nearest centroid (minimizing Euclidean distances between them), meaning that a data point is considered to be in a particular cluster if it is closer to that cluster’s centroid than any other centroid
- Then K-means recalculates the centroids by taking the mean of all data points assigned to that centroid’s cluster, hence reducing the total intra-cluster variance in relation to the previous step. The “means” in the K-means refers to averaging the data and finding the new centroid
- The algorithm iterates between steps 2 and 3 until some criteria is met (e.g. the sum of distances between the data points and their corresponding centroid is minimized, a maximum number of iterations is reached, no changes in centroids value or no data points change clusters)
In this example, after 5 iterations the calculated centroids remain the same, and data points are not switching clusters anymore (the algorithm converges). Here, each centroid is shown as a dark coloured data point. Source: http://ai.stanford.edu
The initial result of running this algorithm may not be the best possible outcome and rerunning it with different randomized starting centroids might provide a better performance (different initial objects may produce different clustering results). For this reason, it’s a common practice to run the algorithm multiple times with different starting points and evaluate different initiation methods (e.g. Forgy or Kaufman approaches).
But another question arises: how do you know the correct value of K, or how many centroids to create? There is no universal answer for this, and although the optimal number of centroids or clusters is not known a priori, different approaches exist to try to estimate it. One commonly used approach is testing different numbers of clusters and measure the resulting sum of squared errors, choosing the K value at which an increase will cause a very small decrease in the error sum, while a decrease will sharply increase the error sum. This point that defines the optimal number of clusters is known as the “elbow point”, and can be used as a visual measure to find the best pick for the value of K.
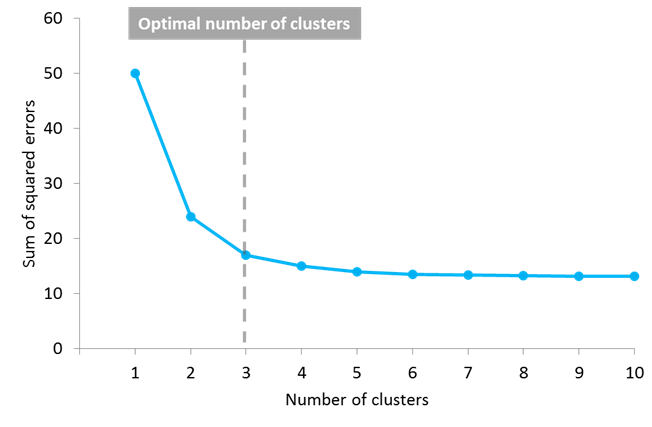
In this example, the elbow point is located in 3 clusters
K-means is a must-have in your data science toolkit, and there are several reasons for this. First of all it’s easy to implement and brings an efficient performance. After all, you need to define just one parameter (the value of K) to see the results. It is also fast and works really well with large datasets, making it capable of dealing with the current huge volumes of data. It’s so flexible that it can be used with pretty much any datatype and its results are easy to interpret and more explainable than other algorithms. Furthermore, the algorithm is so popular that you may find use cases and implementations in almost any discipline.
But everything has a downside
Nevertheless, K-means presents some disadvantages. The first one is that you need to define the number of clusters, and this decision can seriously affect the results. Also, as the location of the initial centroids is random, results may not be comparable and show lack of consistency. K-means produces clusters with uniform sizes (each cluster with roughly an equal quantity of observations), even though the data might behave in a different way, and it’s very sensitive to outliers and noisy data. Additionally, it assumes that data points in each cluster are modeled as located within a sphere around that cluster centroid (spherical limitation), but when this condition (or any of the previous ones) is violated, the algorithm can behave in non-intuitive ways.
Example 1
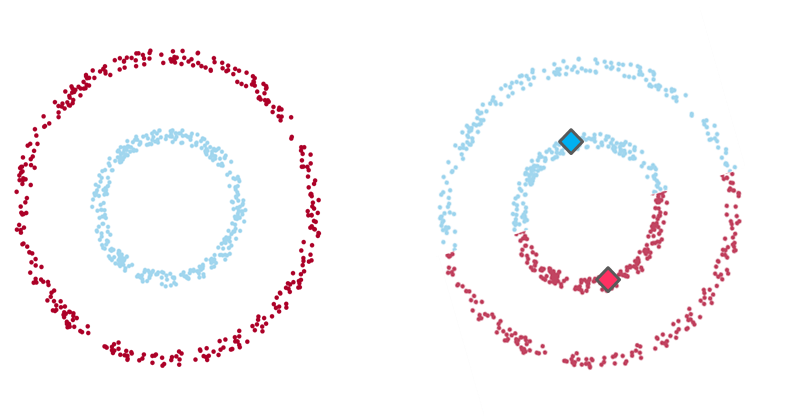
Example 1: On the left-hand side the intuitive clustering of the data, with a clear separation between two groups of data points (in the shape of one small ring surrounded by a larger one). On the right-hand side, the same data points clustered by K-means algorithm (with a K value of 2), where each centroid is represented with a diamond shape. As you see, the algorithm fails to identify the intuitive clustering.
Example 2
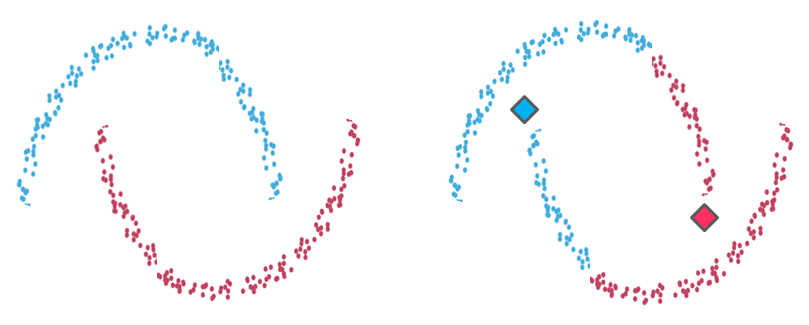
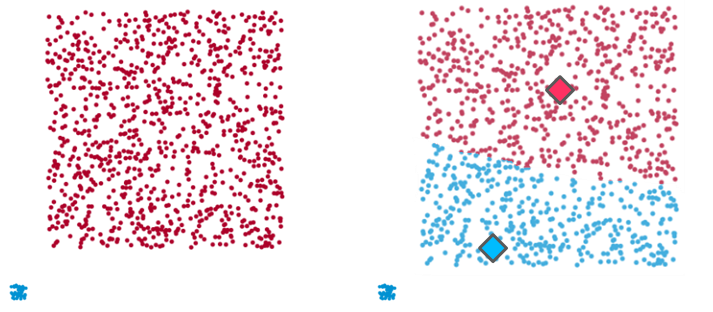
Example 2: On the left-hand side the clustering of two recognizable data groups. On the right-hand side, the result of K-means clustering over the same data points does not fit the intuitive clustering. As in the case of example 1, K-means created partitions that don’t reflect what we visually identify due to the algorithm’s spherical limitation. It tries to find centroids with neat spheres of data around them, and performs badly as the cluster’s geometric shape deviates from a sphere.
Example 3
Example 3: Once again, on the left-hand side there are two clear clusters (one small and tight data group and another larger and dispersed one) which K-means fails to identify (right-hand side). Here, in an attempt to balance the intra-cluster distances between both data groups and generate clusters with uniform sizes, the algorithm blends both data groups and creates 2 artificial clusters that don’t represent the dataset.
It’s interesting to see that K-means doesn’t allow data points that are far away from each other to share the same cluster, no matter how obvious the relation between these data points might be.
What to do now?
The thing is real life data is almost always complex, disorganized and noisy. Situations in the real world rarely reflect clear conditions in which to apply these type of algorithms right out of the shelf. In the case of K-means algorithm it will be expected that at least one of its assumptions gets violated, so we need not only to identify this, but to know what to do in such case.
The good news is that there are alternatives, and deficiencies can be corrected. For example, converting data to polar coordinates can solve the spherical limitation we described in example 1. You may also consider using other types of clustering algorithms if you find serious limitations. Possible approaches would be to use density-based or hierarchical-based algorithms, which fix some of K-means limitations (but have their own limitations).
In summary, K-means is a wonderful algorithm with lots of potential uses, so versatile it can be used for almost any kind of data grouping. But there is never a free lunch: you need to be aware of its assumptions and the way it operates if you don’t want to get guided to wrong results.
Original. Reposted with permission.
Bio: Diego Lopez Yse is an experienced professional with a solid international background acquired in different industries (biotechnology, software, consultancy, government, agriculture).
Resources:
- On-line and web-based: Analytics, Data Mining, Data Science, Machine Learning education
- Software for Analytics, Data Science, Data Mining, and Machine Learning
Related:
- K-Means Clustering: Unsupervised Learning for Recommender Systems
- Iterative Initial Centroid Search via Sampling for k-Means Clustering
- K-Means in Real Life: Clustering Workout Sessions