 Build Pipelines with Pandas Using pdpipe
 Build Pipelines with Pandas Using pdpipe
We show how to build intuitive and useful pipelines with Pandas DataFrame using a wonderful little library called pdpipe.

Introduction
Pandas is an amazing library in the Python ecosystem for data analytics and machine learning. They form the perfect bridge between the data world, where Excel/CSV files and SQL tables live, and the modeling world where Scikit-learn or TensorFlow perform their magic.
A data science flow is most often a sequence of steps — datasets must be cleaned, scaled, and validated before they can be ready to be used by that powerful machine learning algorithm.
These tasks can, of course, be done with many single-step functions/methods that are offered by packages like Pandas but a more elegant way is to use a pipeline. In almost all cases, a pipeline reduces the chance of error and saves time by automating repetitive tasks.
In the data science world, great examples of packages with pipeline features are — dplyr in R language, and Scikit-learn in the Python ecosystem.
A data science flow is most often a sequence of steps — datasets must be cleaned, scaled, and validated before they can be ready to be used
Following is a great article about their use in a machine-learning workflow.
Managing Machine Learning Workflows with Scikit-learn Pipelines Part 1: A Gentle Introduction
Are you familiar with Scikit-learn Pipelines? They are an extremely simple yet very useful tool for managing machine ...
Pandas also offer a .pipe method which can be used for similar purposes with user-defined functions. However, in this article, we are going to discuss a wonderful little library called pdpipe, which specifically addresses this pipelining issue with Pandas DataFrame.
In almost all cases, a pipeline reduces the chance of error and saves time by automating repetitive tasks
Pipelining with Pandas
The example Jupyter notebook can be found here in my Github repo. Let’s see how we can build useful pipelines with this library.
The dataset
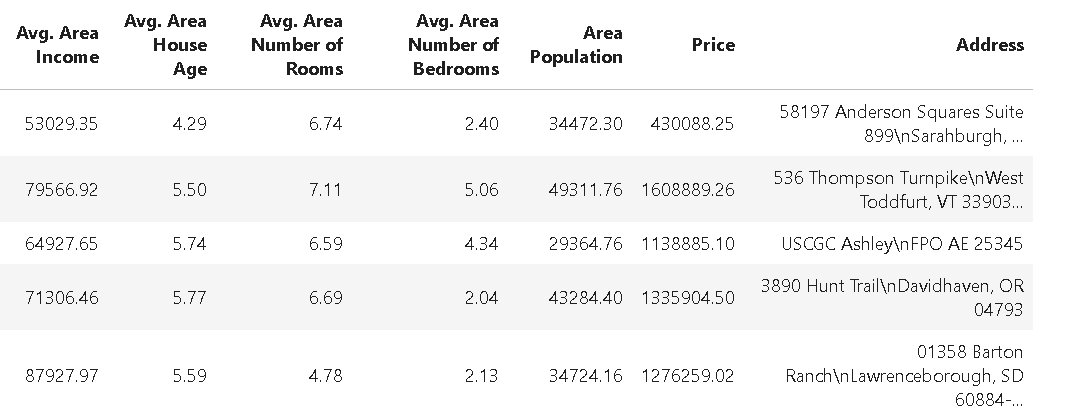
For the demonstration purpose, we will use a dataset of US Housing prices (downloaded from Kaggle). We can load the dataset in Pandas and show its summary statistics as follows,

However, the dataset also has an ‘Address’ field which contains text data.
Adding a size qualifier column
For the demo, we add a column to the dataset qualifying the size of the house, with the following code,
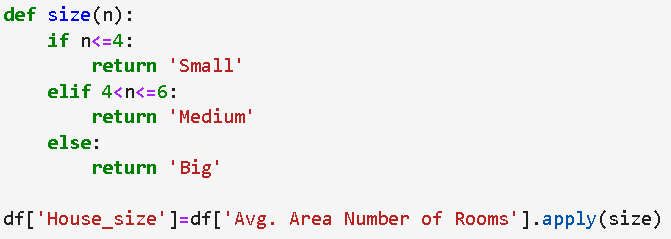
The dataset looks like following after this,

The simplest pipeline — one operation
We start with the simplest possible pipeline, consisting of just one operation (don’t worry, we will add complexity soon enough).
Let’s say the machine learning team and the domain experts say that they think we can safely ignore the Avg. Area House Age data for modeling. Therefore, we will drop this column from the dataset.
For this task, we create a pipeline object drop_age with the ColDrop method from pdpipe and pass the DataFrame to this pipeline.
import pdpipe as pdp
drop_age = pdp.ColDrop(‘Avg. Area House Age’)
df2 = drop_age(df)
The resulting DataFrame, as expected, looks like following,
Chain stages of pipeline simply by adding
Pipelines are useful and practical only when we are able to multiple stages. There are multiple methods by which you can do that in pdpipe. However, the simplest and most intuitive approach is to use the + operator. It is like hand-joining to pipes!
Let’s say, apart from dropping the age column, we also want to one-hot-encode the House_size column so that a classification or regression algorithm can be run on the dataset easily.
pipeline = pdp.ColDrop(‘Avg. Area House Age’)
pipeline+= pdp.OneHotEncode(‘House_size’)
df3 = pipeline(df)
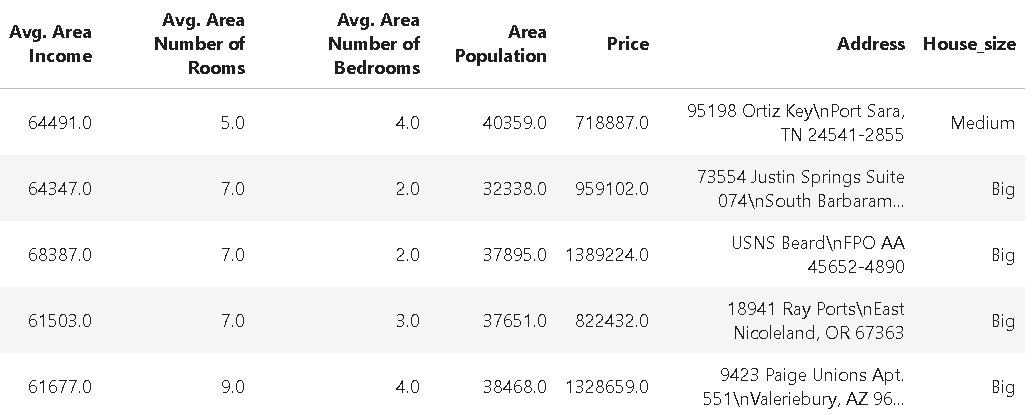
So, we created a pipeline object first with the ColDrop method to drop the Avg. Area House Age column. Thereafter, we just simply added the OneHotEncode method to this pipeline object with the usual Python += syntax.
The resulting DataFrame looks like the following. Note the additional indicator columns House_size_Medium and House_size_Small created from the one-hot-encoding process.

Drop some rows based on their values
Next, we may want to remove rows of data based on their values. Specifically, we may want to drop all the data where the house price is less than 250,000. We have theApplybyCol method to apply any user-defined function to the DataFrame and also a method ValDrop to drop rows based on a specific value. We can easily chain these methods to our pipeline to selectively drop rows (we are still adding to our existing pipeline object which already does the other jobs of column dropping and one-hot-encoding).
def price_tag(x):
    if x>250000:
        return 'keep'
    else:
        return 'drop'
pipeline+=pdp.ApplyByCols('Price',price_tag,'Price_tag',drop=False)
pipeline+=pdp.ValDrop(['drop'],'Price_tag')
pipeline+= pdp.ColDrop('Price_tag')
The first method tags the rows based on the value in the Price column by applying the user-defined function price_tag(),
The second method looks for the string drop in the Price_tag column and drops those rows that match. And finally, the third method removes the Price_tag column, cleaning up the DataFrame. After all, this Price_tag column was only needed temporarily, to tag specific rows, and should be removed after it served its purpose.
All of this is done by simply chaining stages of operations on the same pipeline!
At this point, we can look back and see what our pipeline does to the DataFrame right from the beginning,
- drops a specific column
- one-hot-encodes a categorical data column for modeling
- tags data based on a user-defined function
- drops rows based on the tag
- drops the temporary tagging column
All of this — using the following five lines of code,
pipeline = pdp.ColDrop('Avg. Area House Age')
pipeline+= pdp.OneHotEncode('House_size')
pipeline+= pdp.ApplyByCols('Price',price_tag,'Price_tag',drop=False)
pipeline+= pdp.ValDrop(['drop'],'Price_tag')
pipeline+= pdp.ColDrop('Price_tag')
df5 = pipeline(df)
Scikit-learn and NLTK stages
There are many more useful and intuitive DataFrame manipulation methods available for DataFrame manipulation. However, we just wanted to show that even some operations from Scikit-learn and NLTK package are included in pdpipe for making awesome pipelines.
Scaling estimator from Scikit-learn
One of the most common tasks for building machine learning models is the scaling of the data. Scikit-learn offers a few different types of scaling such as Min-Max scaling, or Standardization based scaling (where mean of a data set is subtracted followed by division by standard deviation).
We can directly chain such scaling operations in a pipeline. Following code demonstrates the use,
pipeline_scale = pdp.Scale('StandardScaler',exclude_columns=['House_size_Medium','House_size_Small'])
df6 = pipeline_scale(df5)
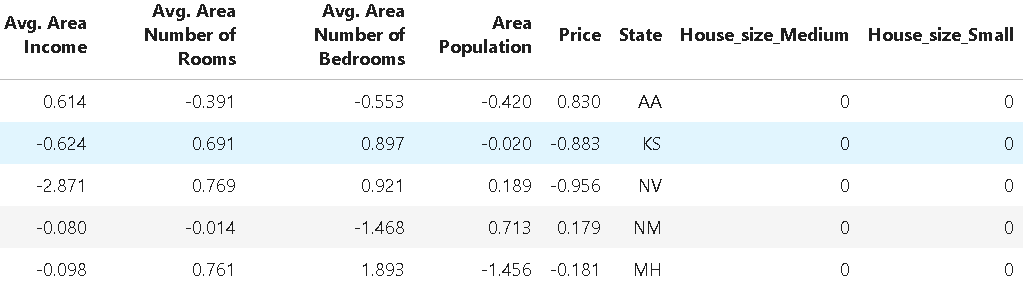
Here we applied the StandardScaler estimator from the Scikit-learn package to transform the data for clustering or neural network fitting. We can selectively exclude columns which do not need such scaling as we have done here for the indicator columns House_size_Medium and House_size_Small.
And voila! We get the scaled DataFrame,

Tokenizer from NLTK
We note that the Address field in our DataFrame is pretty useless right now. However, if we can extract zip code or State from those strings, they might be useful for some kind of visualization or machine learning task.
We can use a Word Tokenizer for this purpose. NLTK is a popular and powerful Python library for text mining and natural language processing (NLP) and offers a range of tokenizer methods. Here, we can use one such tokenizer to split up the text in the address field and extract the name of the state from that. We recognize that the name of the state is the penultimate word in the address string. Therefore, following chained pipeline will do the job for us,
def extract_state(token):
    return str(token[-2])
pipeline_tokenize=pdp.TokenizeWords('Address')
pipeline_state = pdp.ApplyByCols('Address',extract_state,result_columns='State')
pipeline_state_extract = pipeline_tokenize + pipeline_state
df7 = pipeline_state_extract(df6)
The resulting DataFrame looks like following,
Summary
If we summarize all the operations shown in this demo, it looks like the following,

All of these operations may be used frequently on similar types of datasets and it will be wonderful to have a simple set of sequential code blocks to execute as a pre-processing operation before the dataset is ready for the next level of modeling.
Pipelining is the key to achieve that uniform set of sequential code blocks. Pandas is the most widely used Python library for such data pre-processing tasks in a machine learning/data science team and pdpipe provides a simple yet powerful way to build pipelines with Pandas-type operations which can be directly applied to the Pandas DataFrame objects.
Explore this library on your own and build more powerful pipelines for your specific data science task.
If you have any questions or ideas to share, please contact the author at tirthajyoti[AT]gmail.com. Also, you can check the author’s GitHub repositories for code, ideas, and resources in machine learning and data science. If you are, like me, passionate about AI/machine learning/data science, please feel free to add me on LinkedIn or follow me on Twitter.
Original. Reposted with permission.
Related:
- How to Speed up Pandas by 4x with one line of code
- 5 Great New Features in Latest Scikit-learn Release
- Data Pipelines, Luigi, Airflow: Everything you need to know