Idiot’s Guide to Precision, Recall, and Confusion Matrix
Building Machine Learning models is fun, but making sure we build the best ones is what makes a difference. Follow this quick guide to appreciate how to effectively evaluate a classification model, especially for projects where accuracy alone is not enough.

Evaluating ML models
Regression models
RMSE is a good measure to evaluate how a machine learning model is performing.
If RMSE is significantly higher in test set than training-set — There is a good chance model is overfitting. (Make sure train and test set are from same/similar distribution)
What about Classification models?
Guess what, evaluating a Classification model is not that simple
But why?
You must be wondering ‘Can’t we just use accuracy of the model as the holy grail metric?’
Accuracy is very important, but it might not be the best metric all the time. Let’s look at why with an example -:
Let’s say we are building a model which predicts if a bank loan will default or not
(The S&P/Experian Consumer Credit Default Composite Index reported a default rate of 0.91%)
Let’s have a dummy model that always predicts that a loan will not default. Guess what would be the accuracy of this model?
===> 99.10%
Impressive, right? Well, the probability of a bank buying this model is absolute zero. ????
While our model has a stunning accuracy, this is an apt example where accuracy is definitely not the right metric.
If not accuracy, what else?
Along with accuracy, there are a bunch of other methods to evaluate the performance of a classification model
- Confusion matrix,
- Precision, Recall
- ROC and AUC
Before moving forward, we will look into some terms which will be constantly repeated and might make the whole thing an incomprehensible maze if not understood clearly.
Easy right?
Well, not the same feeling after I saw all these ????
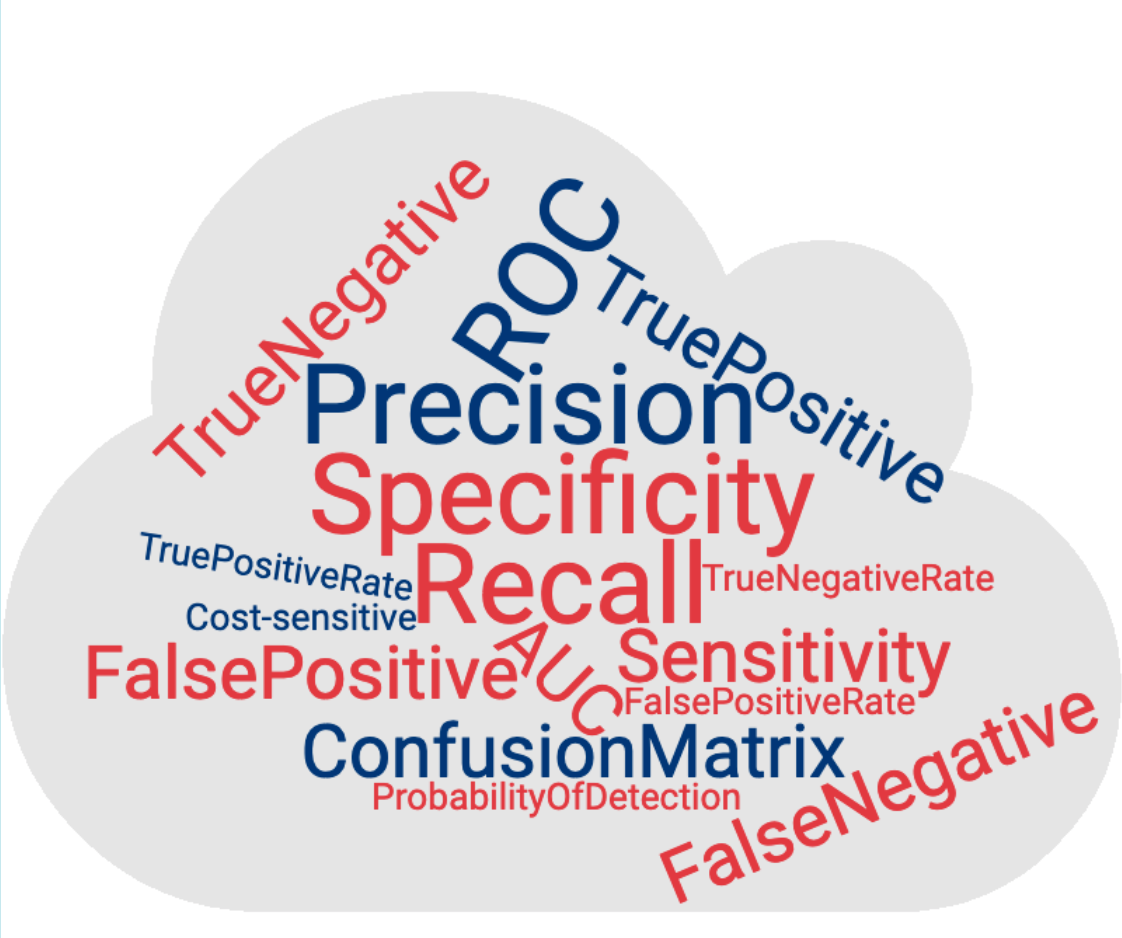
But then as they say — Every cloud has a silver lining
Let’s understand it one by one, starting with the fundamental terms.
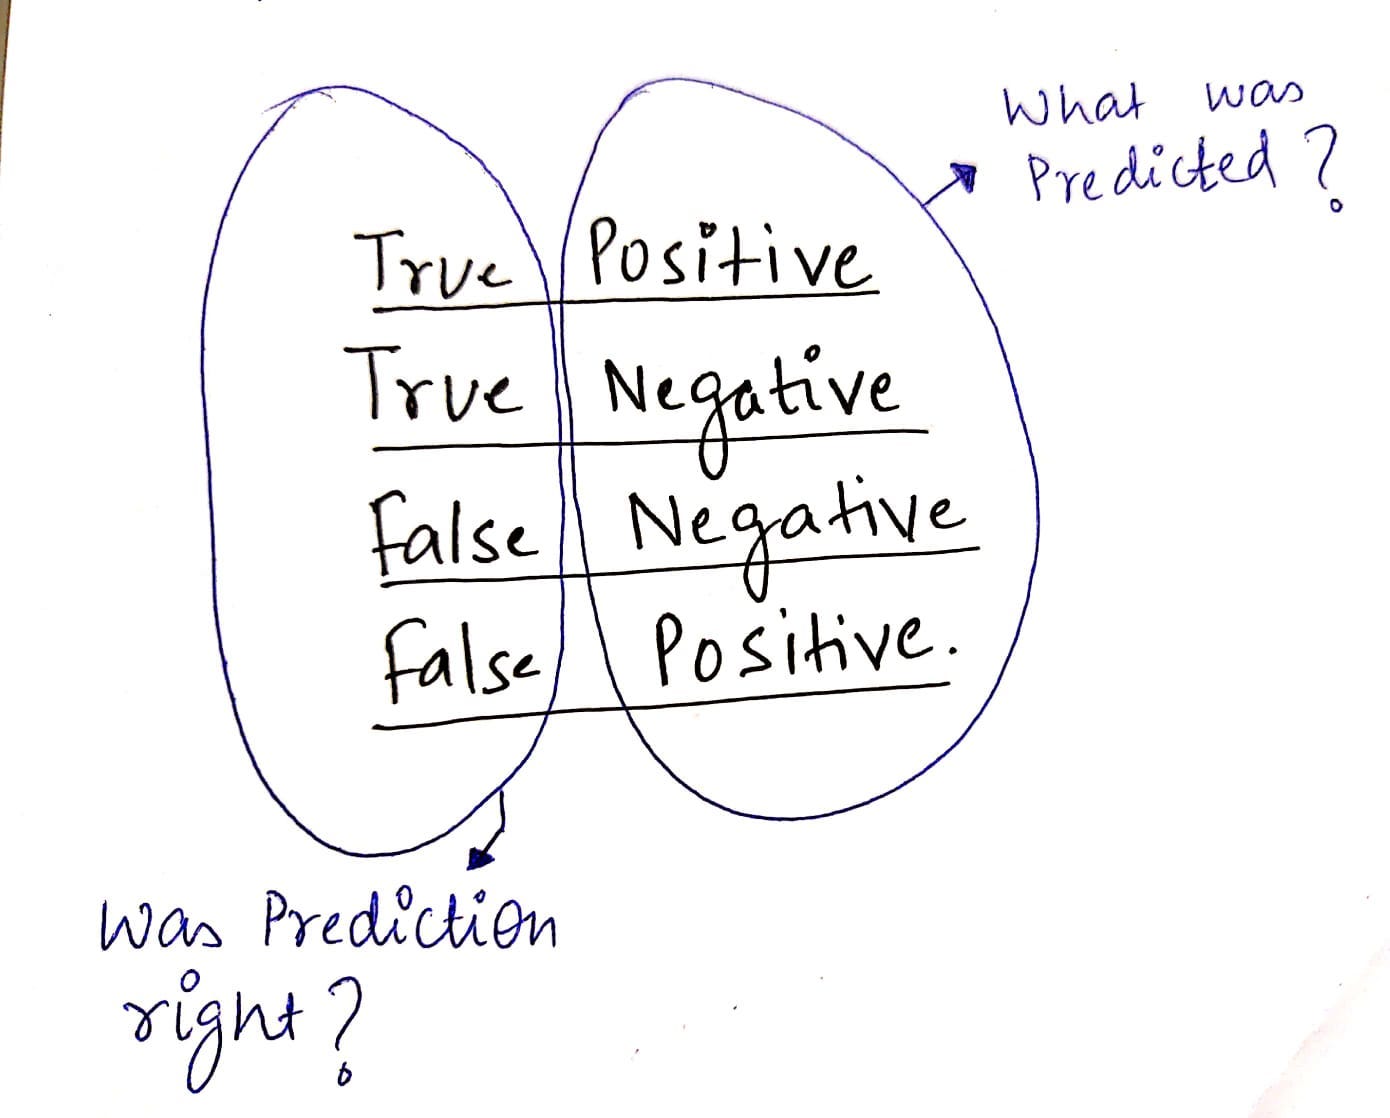
The Positives and Negatives — TP, TN, FP, FN
I use this hack to remember the meaning of each of these correctly.
(Binary classification problem. Ex — Predicting if a bank loan will default)
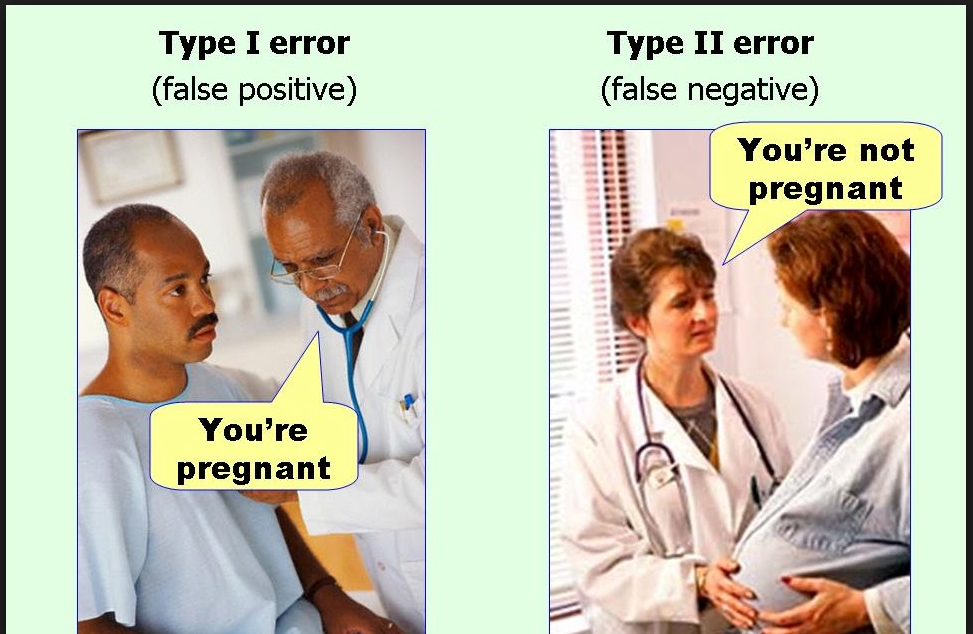
So what is the meaning of a True Negative?
True Negative: We were right when we predicted that a loan would not default.
False Positive: We falsely predicted that a loan would default.
Let's reinforce what we learned
Another picture which stamps it in my mind.
Confusion Matrix
As now we are familiar with TP, TN, FP, FN — It will be very easy to understand what confusion matrix is.
It is a summary table showing how good our model is at predicting examples of various classes. Axes here are predicted-lables vs actual-labels.
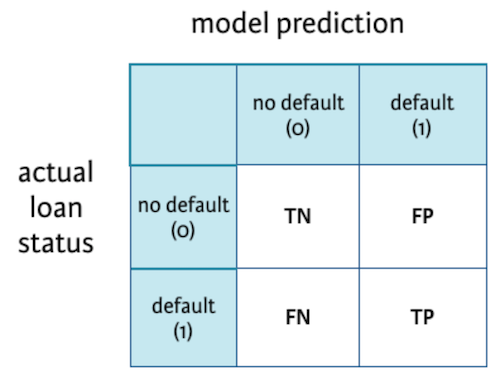
Confusion matrix for a classification model predicting if a loan will default or not.
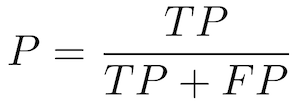
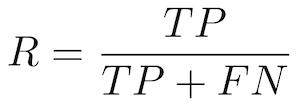
Precision and Recall
Precision — Also called Positive predictive value
The ratio of correct positive predictions to the total predicted positives.
Recall — Also called Sensitivity, Probability of Detection, True Positive Rate
The ratio of correct positive predictions to the total positives examples.
Understanding
To understand Precision and Recall, let’s take an example of Search. Think about the search box on the Amazon home page.

The precision is the proportion of relevant results in the list of all returned search results. The recall is the ratio of the relevant results returned by the search engine to the total number of the relevant results that could have been returned.
In our case of predicting if a loan would default — It would be better to have a high Recall as the banks don’t want to lose money and would be a good idea to alarm the bank even if there is a slight doubt about defaulter.
Low precision, in this case, might be okay.
Note: Mostly, we have to pick one over other. It’s almost impossible to have both high Precision and Recall.
Accuracy
Talking about accuracy, our favourite metric!
Accuracy is defined as the ratio of correctly predicted examples by the total examples.
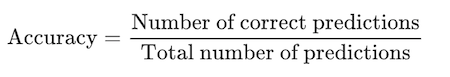
In terms of confusion matrix it is given by:

Remember, accuracy is a very useful metric when all the classes are equally important. But this might not be the case if we are predicting if a patient has cancer. In this example, we can probably tolerate FPs but not FNs.
ROC curve
A ROC curve (receiver operating characteristic curve) graph shows the performance of a classification model at all classification thresholds.
(Using thresholds: Say, if you want to compute TPR and FPR for the threshold equal to 0.7, you apply the model to each example, get the score, and, if the score if higher than or equal to 0.7, you predict the positive class; otherwise, you predict the negative class)
It plots 2 parameters:
- True positive rate (Recall)
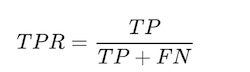
- False Positive rate
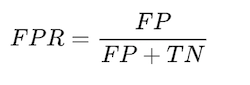
Tells what % of people who were not defaulter were identified as defaulter.
predictions to the total predicted positives.
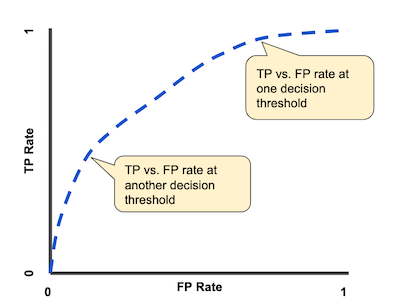
A typical ROC curve.
Lowering the classification threshold classifies more items as positive, thus increasing both False Positives and True Positives.
AUC
AUC stands for Area under the ROC Curve. It provides an aggregate measure of performance across all possible classification thresholds.
The higher the area under the ROC curve (AUC), the better the classifier. A perfect classifier would have an AUC of 1. Usually, if your model behaves well, you obtain a good classifier by selecting the value of the threshold that gives TPR close to 1 while keeping FPR near 0.
Summary
In this post, we saw how a classification model could be effectively evaluated, especially in situations where looking at standalone accuracy is not enough. We understood concepts like TP, TN, FP, FN, Precision, Recall, Confusion matrix, ROC and AUC. I hope it made things clearer!
Original. Reposted with permission.
Vipul Jain is a data scientist with a focus on machine learning with experience building end-to-end data products from ideation to production.