Better notebooks through CI: automatically testing documentation for graph machine learning
In this article, we’ll walk through the detailed and helpful continuous integration (CI) that supports us in keeping StellarGraph’s demos current and informative.
By Huon Wilson, CSIRO Data61

Building a data science library is walking between two worlds: data science is dominated by Python notebooks, a fast and convenient way to experiment and demonstrate code in the browser, while software engineering focuses on making software reliable and repeatable. StellarGraph uses continuous integration to keep the benefits of both.
StellarGraph is an open source, user-friendly Python library for graph machine learning built on TensorFlow and Keras. It provides a lot of demonstrations of its functionality, in the form of Jupyter notebooks, to get data scientists and anyone else started on solving their real-world problems. The demos are viewable directly on GitHub, and even have links to run automatically in the Binder and Google Colab cloud services.
With the release of StellarGraph version 1.0 planned later this month, we’ve developed automatic processes so that our demos work — and will continue to work — even as we make major enhancements to the library.
In this article, we’ll walk through the detailed and helpful continuous integration (CI) that supports us in keeping the library’s demos current and informative.
How it works
StellarGraph’s CI for notebooks works in three main ways:
- Validates that every notebook is up to date and runs successfully, using papermill to keep CI fast for a good developer experience
- Provides links to nbviewer to view failures conveniently in a nicely rendered way, directly in the browser
- Checks that we’re providing a consistent experience by ensuring every notebook has links to cloud services and the same formatting, via black and custom code.
Let’s look at the finer details of each of these.
High velocity; reliable; humans — pick two
Documentation and examples are most useful when they’re accurate. StellarGraph is an active project with constant improvements and bug fixes; many of these allow us to make our notebooks better, and some changes require adjusting a notebook or two. All of this has to be done perfectly.
Our goal is to make sure every demo works every time, following the “not rocket science” rule of software engineering. It’s much easier to keep notebooks working on a pull-request-by pull-request basis. If we don’t keep them up to date, it may take us a long time to even realise they’re broken, let alone diagnose the cause and fix them.
We are careful, and update and rerun notebooks as required, but it’s easy for humans to make mistakes. StellarGraph has more than 40 notebooks, and about 25 pull requests being merged each week. This means that even a low rate of mistakes still results in a lot of broken notebooks.

For instance, suppose each pull request has only a 1% chance of making some notebooks stop working. Be it a small chance, this would mean that there’s only a 78% chance of all notebooks working after a week, and less than 40% chance of all notebooks working after a month.
We try to keep our notebooks working with manual code review, using the ReviewNB app. ReviewNB provides more useful diffs than the raw JSON, making it easy to discuss good and not-so-good changes. However, humans are fallible and can miss problems. Furthermore, code review only highlights notebooks that have had edits; it does not highlight notebooks that should have edits!
Automatically-run notebooks
To help us humans, we utilise computers to check the notebooks too: CI checks that most of them run properly on every pull request and every merge, in addition to the unit tests. But CI works best if it is fast, and, as most of our notebooks demonstrate heavyweight machine learning, it’s not fast enough.
The easiest way to reduce CI time is to do work in parallel. Almost all of the notebooks depend solely on the StellarGraph library, so they can be executed independently of each other. We run them concurrently using a parallel job on Buildkite CI, but it’s still not enough: some of the notebooks individually take too long.
We use papermill to execute our notebooks because it supports parameterisation: when running on CI, our notebooks train their models for less time, or compute shorter random walks, or other optimisations.
Papermill’s parameterisation allows this to be done without having to add ugly “are we on CI” conditional code to each demo. For notebooks that need parameterisation, we only need to refactor slightly to have a single cell that contains the parameters that need to be adjusted. Then, new values can be substituted in via a YAML file and the parameters_file option.
These notebooks are running transiently on CI, so the accuracy of the model isn’t so important. The main thing that’s needed is the execution of every code path, to validate that it all works. We optimise parameters to be as small as possible while still exercising every edge case, such as only reducing the number of training epochs to two instead of one, to catch any problems that occur between epochs.
If there’s a problem, like function arguments changing or even running out of memory, the notebook will fail to run and our testing fails. This tells us immediately that more changes are required to keep everything working.
Highlighting errors with Buildkite artifacts and annotations
CI helps us see when something has gone wrong, but it’s even better to know the exact problem. Papermill is helpful by logging all of the stdout and stderr output of the notebook; but digging through verbose CI logs is cumbersome. Furthermore, these logs often don’t have enough context to easily understand the problem especially compared to the rendered view of a notebook, where the error is attached to an individual cell, along with any other relevant cells.
After running a notebook, the CI attaches the resulting notebook as an “artifact” to the step that ran it, whether it passed or not. If execution failed, this output notebook will include the exception or other error inside it.
We’re using a public pipeline on Buildkite, so the artifacts are publicly viewable, meaning the pull request author — or anyone else — can click through and download them to inspect the problems.
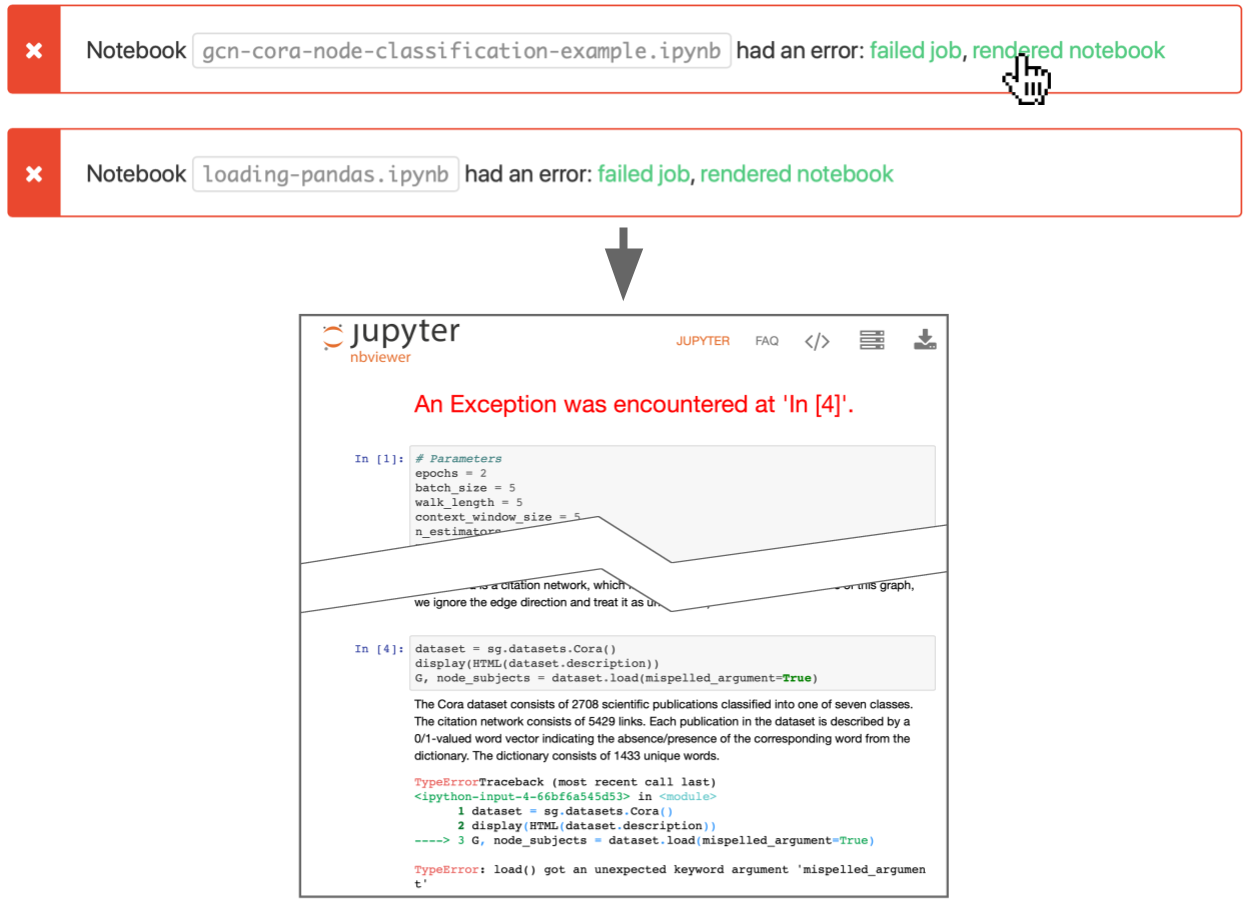
We do a lot more with Buildkite too. Nbviewer can render any public Jupyter notebook URL, including these artifacts. Our CI creates links to view them directly in the browser and, for notebooks that failed, adds an annotation to the top of the build with that link. All it takes to understand the problem is to view the failing build and click on one of the highlighted links.
A consistent demo experience
StellarGraph works to provide a consistent experience for each demo because this makes it easier for:
- users of StellarGraph to switch between demos without having to understand the idiosyncrasies of each one
- developers of StellarGraph to write and edit the notebooks, because more parts of the process have an expected behaviour, and there’s no time-wasting on things like formatting
- automatic tools to help us maintain demos, because the input notebooks are more structured.
The foundational piece of this is a custom script that uses nbconvert to run some notebook preprocessors. These preprocessors do things like:
- format the code with the black formatter
- renumber the cell execution counts from 1, so that someone making edits can run and rerun the notebook as many times as they need until it works and the notebook still shows “In [1], Out [1], In [2], Out [2], …” when published
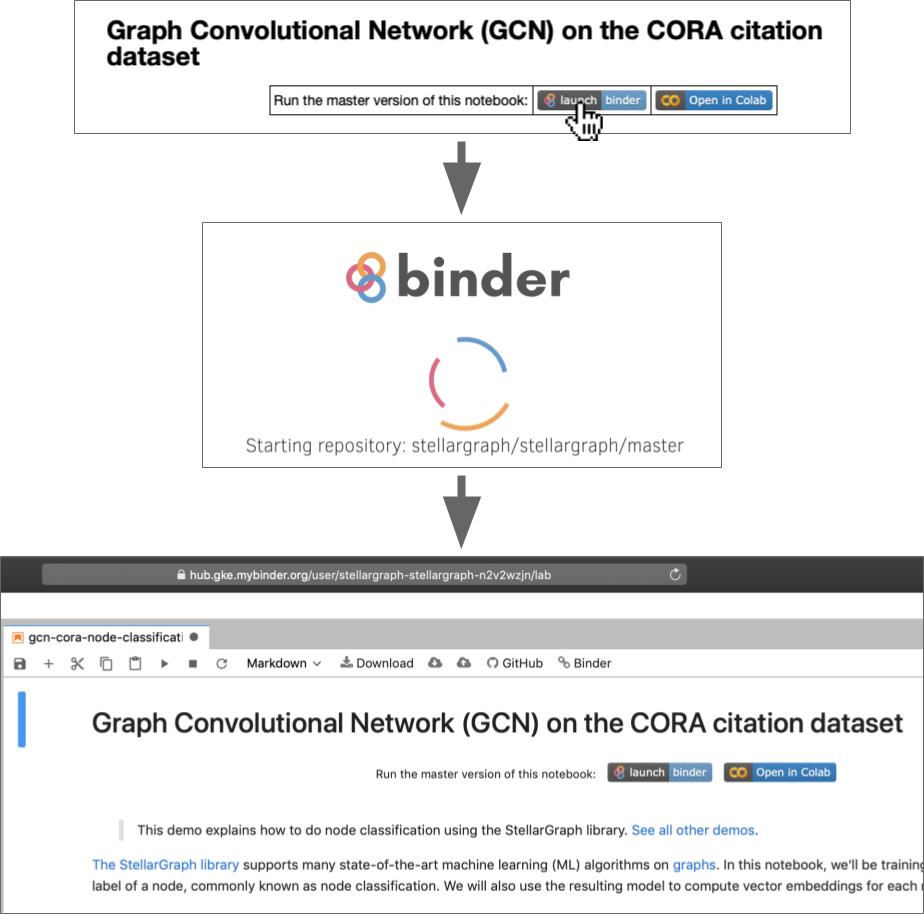
- insert the appropriate link for each notebook to the Binder and Google Colab cloud services, so that people viewing the demos on GitHub can switch to executing them in a flash.
This script makes it easy for a developer to keep the notebooks consistent by applying all that formatting directly with a single command. Unfortunately, making it easy is only half the story; requiring humans to remember to do it will mean it is occasionally forgotten.
The solution here is the same as for running the notebooks: check the formatting on CI. Our script supports this via a mode where it reformats the notebook to a temporary path, and then compares the reformatted notebook with the original: they should be the same.
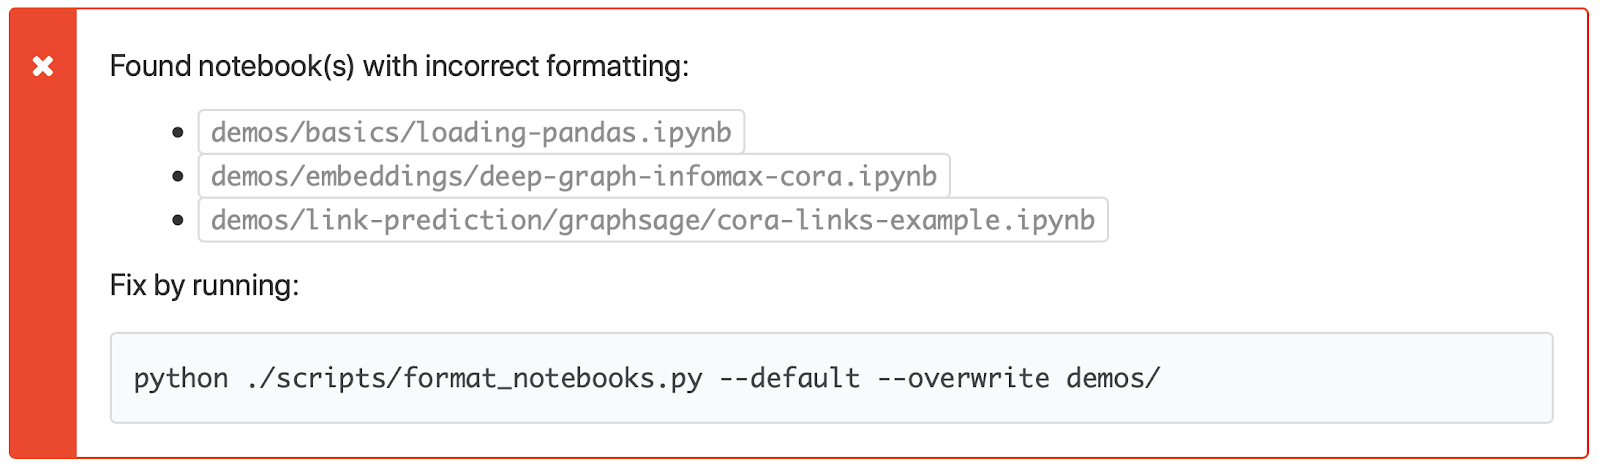
If there’s a difference, the script will add an annotation to the build that suggests an appropriate command for fixing it.
Conclusion
StellarGraph prides itself on its demos and we rely on automation to keep them great, even in a high-velocity project as we build up to our 1.0 release. We get a nice review experience via ReviewNB, and get alerted when a notebook fails to run or has inappropriate formatting. All of this happens before landing any changes, and problems are flagged with convenient links and suggested fixes using Buildkite CI.
All our code is open source, so we hope by sharing others can mesh the worlds of data science and software engineering and see the benefits of both.
Get started with graph machine learning in the StellarGraph library with our demo of node classification using a Graph Convolutional Network.
The CI work in StellarGraph was largely done by Tim Pitman, with contributions from Huon Wilson. The formatting script was mostly written by Andrew Docherty with extensions from Tim and Huon. Denis Khoshaba keeps our CI and infrastructure working smoothly. To make papermill work even better on CI, Huon contributed several tweaks.
This work is supported by CSIRO’s Data61, Australia’s leading digital research network.
Bio: Huon Wilson is a software engineer with a strong background in mathematics and statistics, with significant experience in low-level systems programming fields like compilers, and languages like C++, C as well as more exotic ones like Rust. At a higher level, he has experience with numerical programming in R and Python, and with most language paradigms and many other areas of software engineering.
Original. Reposted with permission.
Related:
- Graph Neural Network model calibration for trusted predictions
- Scalable graph machine learning: a mountain we can climb?
- Graph Machine Learning Meets UX: An uncharted love affair