Forecasting Stories 4: Time-series too, Causal too
This article is about the story of taking effective business decisions basis a combined model. Let us together study how these components work hand in hand.
By Rajneet Kaur, Data Scientist
If every December peaks, will this one too?
Time-series forecasting will tell you it will. But what if we increase price by 30%, will it peak, dip or remain stable?
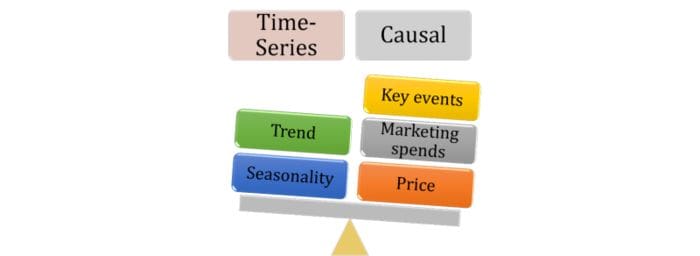
I remember some of the earliest lessons learnt on prediction ~8 years ago. There are 2 types of predictive models: Time-series and Causal. But if we check the above example, more often that not, we require both to work in tandem.

This article is about the story of taking effective business decisions basis a combined model. Let us together study how these components work hand in hand:
WHAT SHOULD MY MARKETING SPENDS BE?
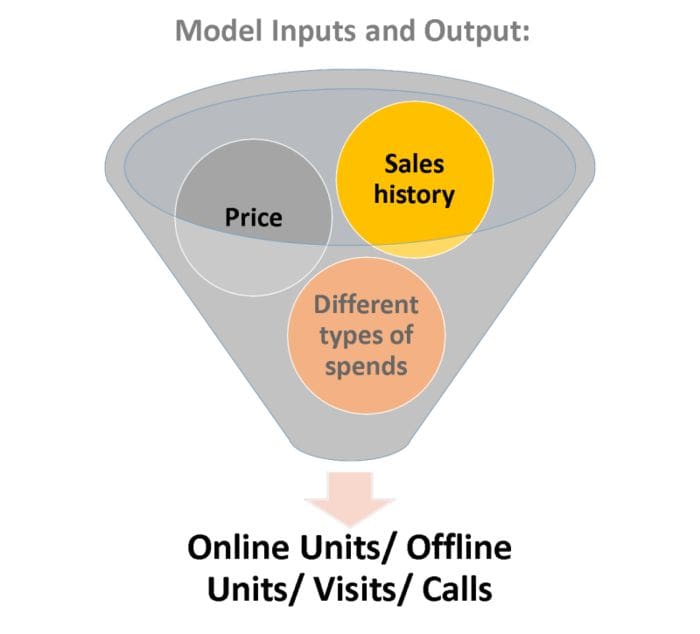
Personal computer is a high-tech product, influenced by industry trends as well as promotional spends, and pricing decisions such as discounts. Often the real controllables for a business are pricing and marketing spends. As a consultant to the direct channel marketing team of a top OEM, our role was to help determine:
Expected PC unit sales(online, offline), website visits and calls from customers
Ideal marketing budget and mix to achieve a target
Since the 2 outputs mentioned above require studying across time as well as on influencing factors like spends, we would require a model with both time-series and causal angles.
While there are different algorithms that can allow the same, we implemented the same through ARIMAX. ARIMAX is a beautiful algorithm - its allows you to auto-correlate as well as regress with other independent variables. If you have implemented ARIMA or ARMA, ARIMAX has and additional element, i.e. regression. X stands for exogenous variables or dependent variables or co-variates.
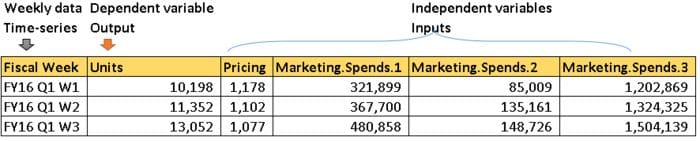
The model construct was:
The key learnings from this exercise include:
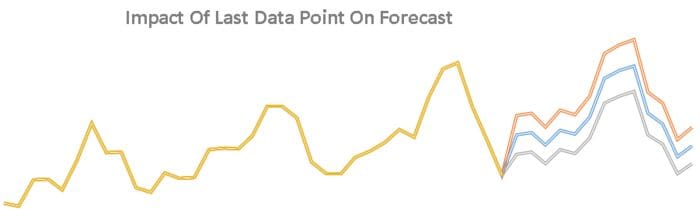
1. The historical last data point impacts the forecast much more than expected - hence try to choose the locking period bases an average data point
2. The business learnings, which may seem obvious for a marketing expert were:
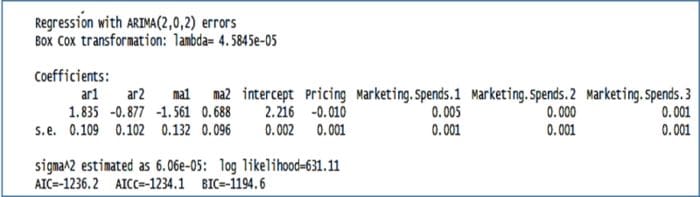
- Importance of variables: Pricing was more significant, i.e. had higher coefficient than marketing spends for an online units model, whereas as the reverse was true when it came to website visits
- Push/demand generation/lower funnel spends(Marketing.Spends.1) were far more significant than pull/brand building/upper funnel spends(Marketing.Spends.2 and Marketing.Spends.3)
3. The coefficient of a marketing spend may be -ve. For instance, online spends may cannibalize offline units, and this is possible. However the total benefit should out-weigh the cost, i.e. the gain in online units should be higher than loss in offline units. However, it will still be an art to explain to your client why this is logical. The other art is to make the spend a low positive value by playing with your p,d,q values.
Hope you enjoyed the article. If you find this article interesting, do like and comment.
To start with the first story in the set, follow the order: stories 1, stories 2 and stories 3. I have also written Analytics Frameworks for problem solving in the data science world.
Bio: Rajneet Kaur is a passionate and result-driven marketing and data science executive with 6 years of business and technology experience.
Original. Reposted with permission.
Related:
- Forecasting Stories: Is it seasonality or not?
- Forecasting Stories 2: The Power of a Seasonality Index
- Forecasting Stories 3: Each Time-series Component Sings a Different Song