Comprehensive Guide to the Normal Distribution
Drop in for some tips on how this fundamental statistics concept can improve your data science.

The distribution of data refers to the way the data is spread out. In this article, we’ll discuss the essential concepts related to the normal distribution:
- Ways to measure normality
- Methods to transform a dataset to fit the normal distribution
- Use of the normal distribution to represent naturally occurring phenomena and offer statistical insights
Overview
Data distribution is of great importance in statistics because we are pretty much always sampling from a population where the full distribution is unknown. The distribution of our sample may put limitations on the statistical techniques available to us.
The normal distribution is a frequently observed continuous probability distribution. When a dataset conforms to the normal distribution, it is possible to utilize many handy techniques to explore the data:
- Knowledge of the percentage of data within each standard deviation
- Linear least squares regression
- Inference based on the sample mean (e.g., t-test)
In some cases, it’s beneficial to transform a skewed dataset so that it conforms to the normal distribution, thereby unlocking the use of this set of statistical techniques. This is more likely to be relevant when your data is almost normally distributed except for some distortion. More on this in a moment.
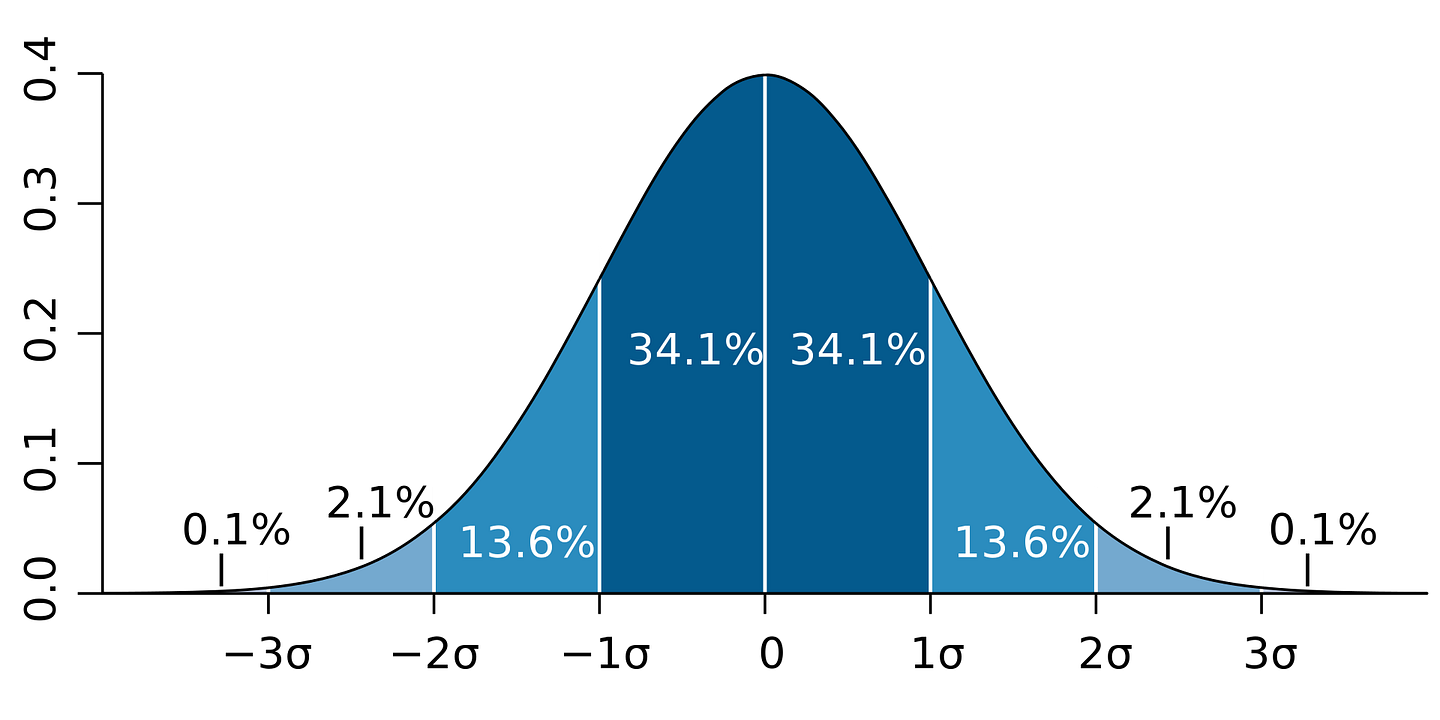
Normal distributions have the following features:
- Symmetric bell shape
- Mean and median are equal (at the center of the distribution)
- ≈68% of the data falls within 1 standard deviation of the mean
- ≈95% of the data falls within 2 standard deviations of the mean
- ≈99.7% of the data falls within 3 standard deviations of the mean
Here are some terms you should be familiar with relevant to a general overview of the normal distribution:
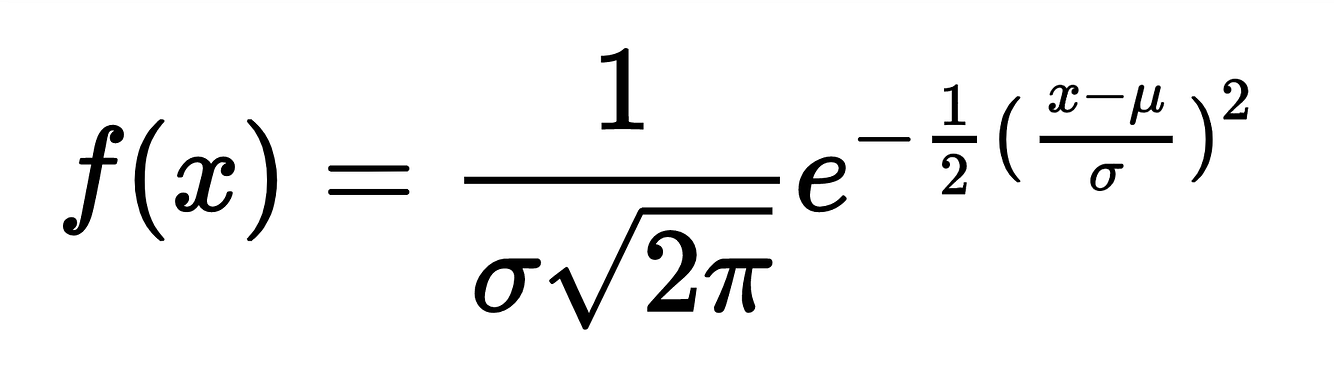
- Normal Distribution: a symmetric probability distribution that is frequently used to represent real-valued random variables; sometimes called the bell curve or Gaussian distribution
- Standard Deviation: measure of the amount of variation or dispersion of a set of values; calculated as the square root of variance
- Variance: the distance of each data point from the mean
How to use the Normal Distribution
If your dataset does not conform to the normal distribution, here are some suggestions:
- Collect more data: a small sample size or lack of data quality could be distorting your otherwise normally distributed dataset. As is often the case in Data Science, the solution could be to collect more data.
- Reduce sources of variance: reduction of outliers could result in normally distributed data.
- Apply a power transform: for skewed data, you might choose to apply the Box-Cox method, which refers to taking the square root and the log of the observation.
In the sections that follow, we’ll explore some measures of normality and how you would use them in a Data Science project.
Skewness
Skewness is a measure of asymmetry relative to the mean. Here’s a graph of a left skewed distribution.
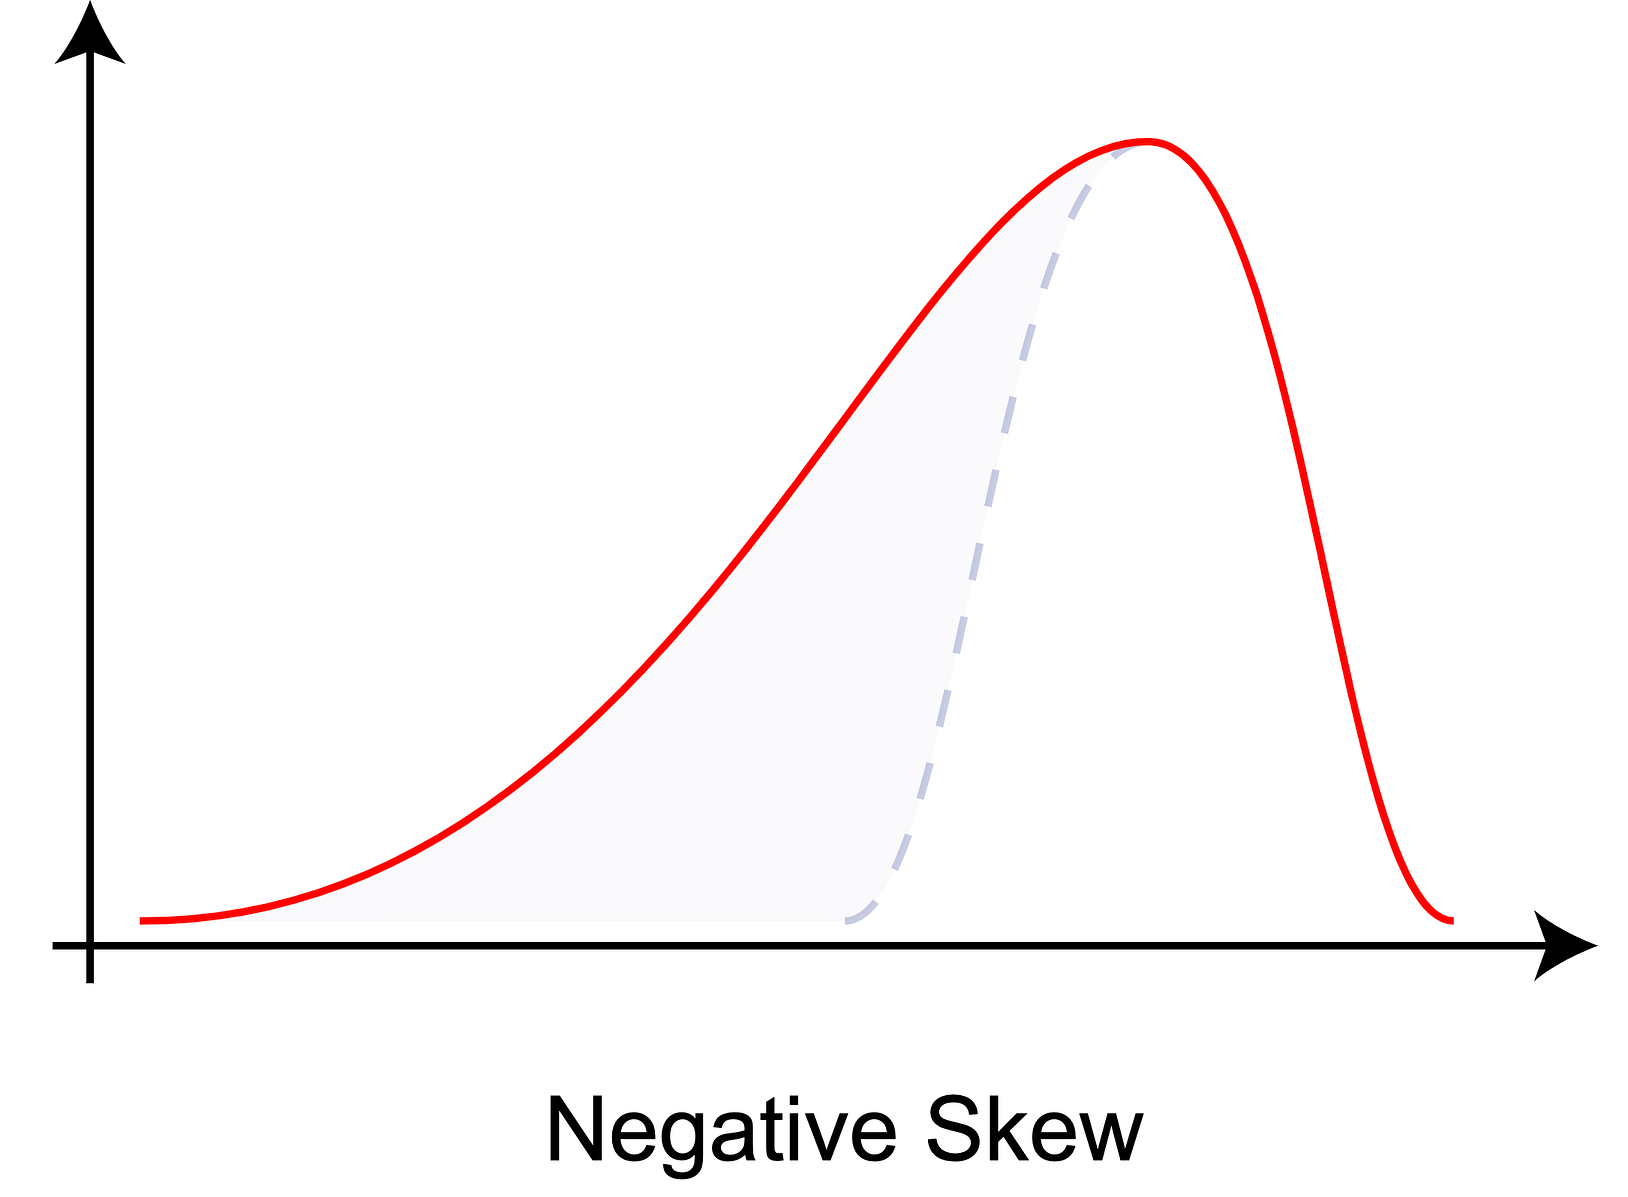
???? I’ve always found this to be a bit counterintuitive, so it’s worth paying close attention here. This graph has negative skewness. This means that the tail of the distribution is longer on the left. The counterintuitive bit (to me at least) is that most of the data points are clustered to the right. Do not be tempted to confuse with right or positive skewness, which would be represented by this graph’s mirror image.
How to use Skewness
Understanding skewness is important because it is a key factor in model performance. To measure skewness, use skew from the scipy.stats module.
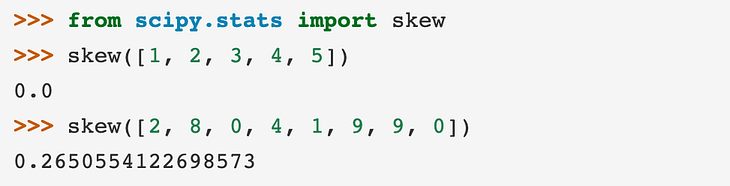
The skewness measure can clue us in to potential deviation in model performance across the feature values. A positively skewed feature, like the second array above, will enable better performance on lower values, given that we’re providing more data in that range (opposed to higher value outliers).
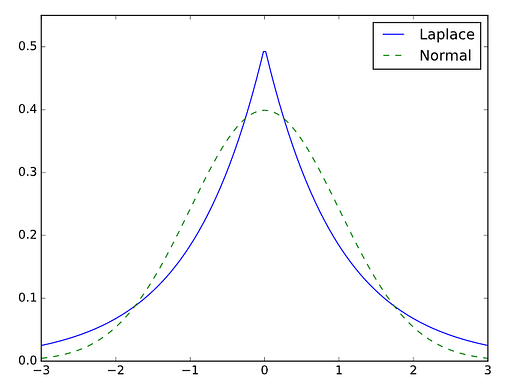
Kurtosis
From Greek kurtos, meaning curved, kurtosis is a measure of the tailedness of the distribution. Kurtosis is typically measured relative to 0, the kurtosis value of the normal distribution using Fisher’s definition. A positive kurtosis value indicates “fatter” tails (i.e., a slimmer bell curve with more outliers).
How to use Kurtosis
Understanding kurtosis provides a lens to the presence of outliers in a dataset. To measure kurtosis, use kurtosis from the scipy.stats module.
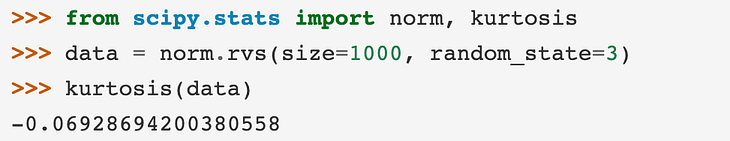
A negative kurtosis value indicates data that is more tightly grouped around the mean with fewer outliers.
A caveat about the Normal Distribution
You may have heard that many naturally occurring datasets conform to the normal distribution. This claim has been made for everything from IQ to human heights.
While it’s true that the normal distribution is drawn from observations of nature and does occur frequently, we risk oversimplification by applying this assumption too liberally.
The normal model often doesn’t fit well in the extremes. It often underestimates the probability of rare events. The Black Swan by Nassim Nicholas Taleb gives numerous examples of rare events that were not as rare as a normal distribution would predict.
Why heights are not normally distributed
In my previous post, I speculated on why heights are normally distributed, that is, why their statistical distribution...
Summary
In this brief article on the normal distribution, we covered some fundamental concepts, how it is measured, and how it is used. Be careful not to overapply the normal distribution or you risk discounting the likelihood of outliers. Hope this article provided some insight on this commonly observed and highly useful statistical concept.
More Articles You Might Enjoy
How to Use Clustering to Create a Neighborhood Explorer Tool
A step-by-step walkthrough of using sklearn’s clustering algorithm to create an interactive dashboard for your city.
Data Science for the New Normal — Lessons from a $1.4B Startup
Post-COVID, machine learning is increasingly crucial for business success.
10 Python Skills They Don’t Teach in Bootcamp
Ascend to new heights in Data Science and Machine Learning with this list of coding tips.
Bio: Nicole Janeway Bills is Data Scientist with experience in commercial and federal consulting. She helps organizations leverage their top asset: a simple and robust Data Strategy. Sign up for more of her writing.
Original. Reposted with permission.
Related:
- Overview of data distributions
- Essential Math for Data Science: The Poisson Distribution
- Looking Normal(ly Distributed)