Find the Best-Matching Distribution for Your Data Effortlessly
How to find the best-matching statistical distributions for your data points — in an automated and easy way. And, then how to extend the utility further.
What’s our goal?
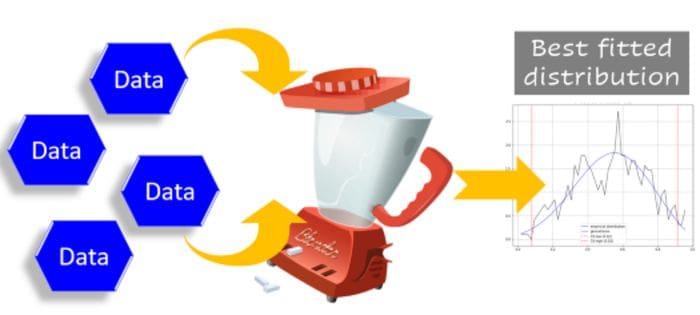
Image source: Prepared by the author with Pixabay image (Free to use)
You have some data points. Numeric, preferably.
And you want to find out which statistical distribution they might have come from. Classic statistical inference problem.
There are, of course, rigorous statistical methods to accomplish this goal. But, maybe you are a busy data scientist. Or, a busier software engineer who happens to be given this dataset to quickly write an application endpoint to find the best distribution that matches the data. So that another machine learning app can use some synthetic data generated based on this distribution.
In short, you don’t have a lot of time on hand and want to find a quick method to discover the best-matching distribution that the data could have come from.
Basically, you want to run an automated batch of goodness-of-fit (GOF) tests on a number of distributions and summarize the result in a flash.
You can, of course, write code from scratch to run the data through standard GOF tests using say Scipy library, one by one, for a number of distributions.
Or, you can use this small but useful Python library — distfit to do the heavy lifting for you.
Distfit — a Python library to automatically fit distributions to data
As per their website, distfit is a python package for probability density fitting of univariate distributions. It determines the best fit across 89 theoretical distributions using the Residual Sum of Squares (RSS) and other measures of GOF.
Let’s see how to use it. Here is the demo notebook.
Install as usual,
pip install -U distfit
Generate test data and fit it
Generate some Normally distributed test data and fit them to the distfit object.
Basically, you want to run an automated batch of goodness-of-fit (GOF) tests on a number of distributions and summarize the result in a flash
How good is the fit?
So, was the fit any good?
Note, in the code above the model dist1 has no knowledge of the generative distribution or its parameters i.e. the loc or scale parameters of the Normal distribution or the fact that we called np.random.normal to generate the data.
We can test the goodness of fit and the estimated parameters in one shot by a simple piece of code,
dist1.plot(verbose=1)
Here is the expected plot (note that the plot will definitely look somewhat different in your case because of the random nature of the generated data).
Note the loc and scale parameters as estimated by the fitting process in the plot subtitle. Pretty close to the parameter values we set earlier, aren’t they? The estimated distribution type is displayed as norm i.e. a Normal Distribution. Right on.
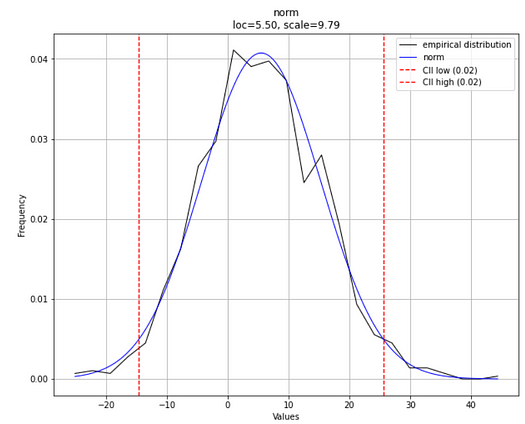
Image created by the author
More info about the fitted model
With another one-liner code, you can get the summary of all the distributions that were fitted to the data (internally) and tested for the goodness of fit.
dist1.summary
You will get something like this,
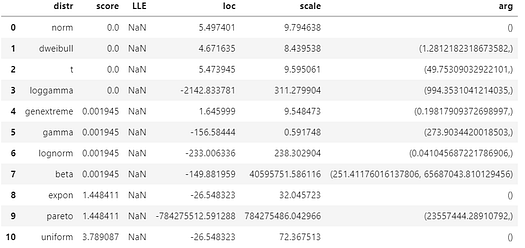
Image created by the author
This shows all the parameters of various distributions tested with the given data. It also shows the score which indicates the goodness of fit — the distance between the expected data and the given data i.e. lower is better. Note that more than one distribution had the identical score of zero in this model but the Normal distribution was chosen as the most plausible one under internal logic.
Why only 10 distributions in this summary? Because, by default, it uses a list of the most popular 10 distributions to scan through. You can specify the exact list as an argument to the distfit object while initializing it.
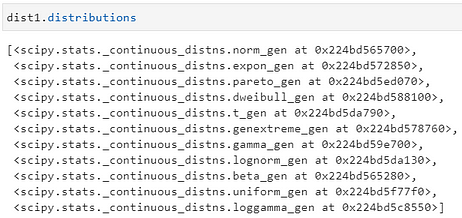
Using Scipy internally
If you type dist1.distributions then you will see a list of functions that were used for the fitting process and they are from the Scipy package.
Don’t stop at the fitting, generate synthetic data too
As an add-on, distfit model provides the API to generate data based on the best-fitted distribution easily. Here, we generate 10 random variates with loc=5.5 and scale=9.79 (as fitted earlier).

Things you have to watch out for
The estimation can be wrong if there is a lot of similarity between the shape of the data of two or more distributions. Particularly, if the sample size (training data) is small.
For example, let’s generate some data from the Beta distribution with parameters chosen such as they look almost like Normal distribution. If we choose the parameters α and β to be equal or close, we can accomplish this. And then, if you fit 1000 data points, you may get Normal distribution as the best-fitted distribution.

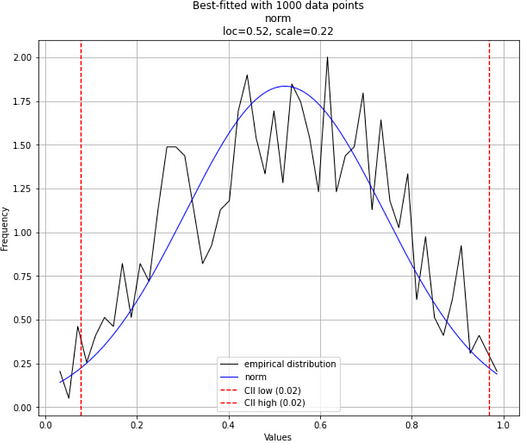
Image created by the author
However, if you extend that to 10,000 points sample size, you will most likely get the correct answer.
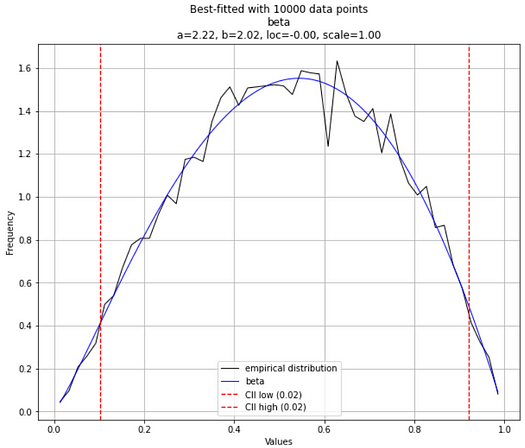
Image created by the author
Other things you can do
You can choose which statistical test (RSS, Kolmogorov-Smirnov, etc.) to use for determining the best fit.
You can also specify the exact list of distributions you want to run through.
You can use the distfit.predict method to predict the probability of a response variable.
We have shown examples of continuous distribution fitting only. You can do fitting with discrete distributions too.
Why is this an example of “productive data science”?
I consider using utility packages such as distfit a prime example of doing productive data science.
I have written about what productive data science is in this article. Essentially, it means doing the same data science activities at a higher speed, in a robust manner.
Why and how should you learn “Productive Data Science”?
You can write pure Python code with Scipy functions from scratch to loop through various distributions and run GOF tests for the data you have. But why would you waste your time when somebody has already written an excellent library (with high-quality documentation) for the exact same task?
That’s why you can think of distfit whenever you want to fit your univariate data to the optimum distribution and get all the statistical properties in one shot.
You can check the author’s GitHub repositories for code, ideas, and resources in machine learning and data science. If you are, like me, passionate about AI/machine learning/data science, please feel free to add me on LinkedIn or follow me on Twitter.
Original. Reposted with permission.
Bio: Tirthajyoti Sarkar is a Data Science/ML Manager at Adapdix Corp. He contributes regularly to publications such as KDnuggets and TDS on diverse topics related to data science and machine learning. He has authored data science books and contributes to open source software. Tirthajyoti holds a Ph.D. in EE and is working on an M.S. degree in Computational Data Analytics. Email him at tirthajyoti at gmail[dot]com.
Related:
- Create Synthetic Time-series with Anomaly Signatures in Python
- How to do “Limitless” Math in Python
- Teaching AI to Classify Time-series Patterns with Synthetic Data