How to frame the right questions to be answered using data
Understanding your data first is a key step before going too far into any data science project. But, you can't fully understand your data until you know the right questions to ask of it.

Photo by You X Ventures on Unsplash.
Data science is an interdisciplinary field that uses the scientific method, processes, and algorithms to extract knowledge and insights from data. The field of data science has several subdivisions, such as data mining, data transformation, data visualization, machine learning, deep learning, etc. In this article, we will focus on how to ask meaningful questions that could be answered using data. The quality of any analysis performed on data depends on your ability to frame the right questions. The following tips will help you to frame the right questions to be addressed with data.
- Explore your data: Before performing any analysis on your data, it is important to explore the available data carefully. This would help you understand the scope of the data, its quality, its type (ordinal or categorical; static or dynamic), patterns in the data, and relationships between features in the data.
- Determine the type of problem to be addressed using the data: Depending on your dataset, the problem to be solved could fall under one of the following categories: descriptive analytics, predictive analytics, or prescriptive analytics. These three categories of data science tasks will be discussed in greater details in the case studies section below.
- Understand your limitations as a data scientist: A data scientist might not have domain knowledge about the system of interest. For instance, depending on the organization you are working for, you may have to work with a team of engineers (industrial dataset), doctors (healthcare dataset), etc., in order to figure out predictor features and target features to use in your model. For example, an industrial warehouse system may have sensors that generate data in real-time to track operations in the warehouse. In this case, as a data scientist, you may not have technical knowledge about the system in question. So, you would have to work with engineers and technicians for them to guide you to decide what features are of interest and what are the predictor variables and the target variable. Teamwork is, therefore, essential to piece together different aspects of the project. From my personal experience working on an industrial data science project, my team had to work with system engineers, electrical engineers, mechanical engineers, field engineers, and technicians over a period of 3 months just to understand how to frame the right questions to be solved with the available data. Such a multidisciplinary approach to problem-solving is essential in real-world data science projects.
We now examine different case studies of data science projects and the questions needing answers from data.
Descriptive Data Analysis
In descriptive analytics, you are interested in studying relationships between features in your dataset. Data visualization plays an essential role here. You need to decide the type of data visualization that is suitable for the project at hand. It could be a scatter plot, barplot, line graph, density plot, heat map, etc. Some examples of data visualization projects are presented below.
Simple barplot: Here, the project is to display the electric vehicle shares for 7 industrialized countries.
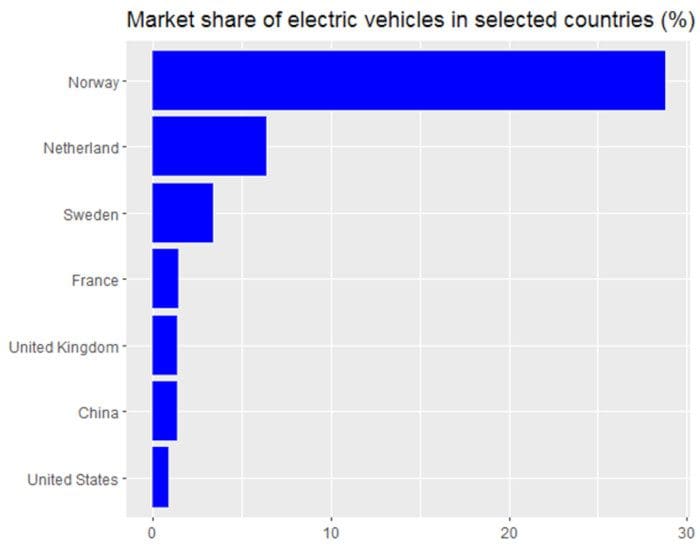
Figure 1. 2016 Market share of electric vehicles in selected countries. Image by Benjamin O. Tayo.
The dataset and code used for generating Figure 1 can be found here: 2016 global market share for electric vehicles.
Barplot with a categorical variable: Here, the project is to display marketing emails from 3 companies: Best Buy (BBY), Walgreens (WGN) and Walmart (WMT).
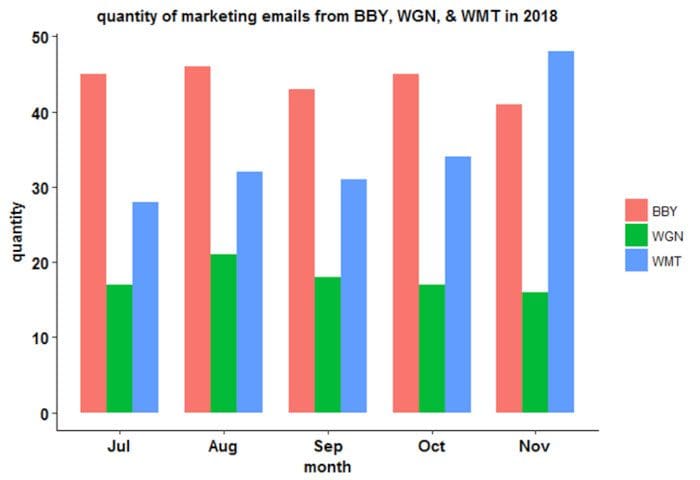
Figure 2. Quantity of advertising emails from Best Buy (BBY), Walgreens (WGN) and Walmart (WMT) in 2018. Image by Benjamin O. Tayo.
The dataset and code used for generating Figure 2 can be found here: barplot for personal marketing emails.
Barplot for comparison: Here, the project is to compare the worldwide number of tech jobs by skills.
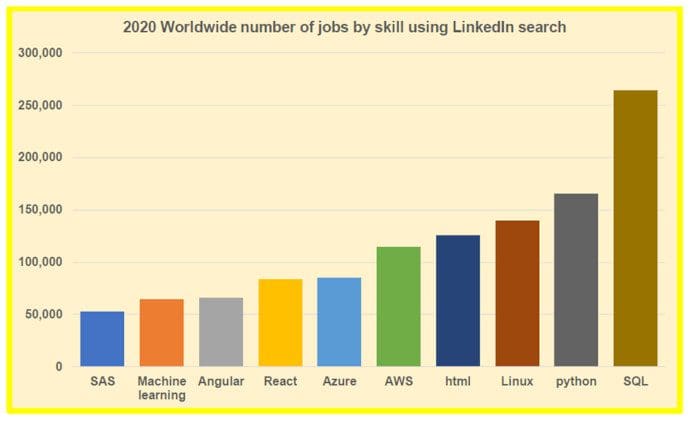
Figure 3. 2020 Worldwide number of jobs by skill using the LinkedIn search tool. Image by Benjamin O. Tayo.
Heatmap plot: Here, the problem is to study and quantify correlations between features in a dataset.
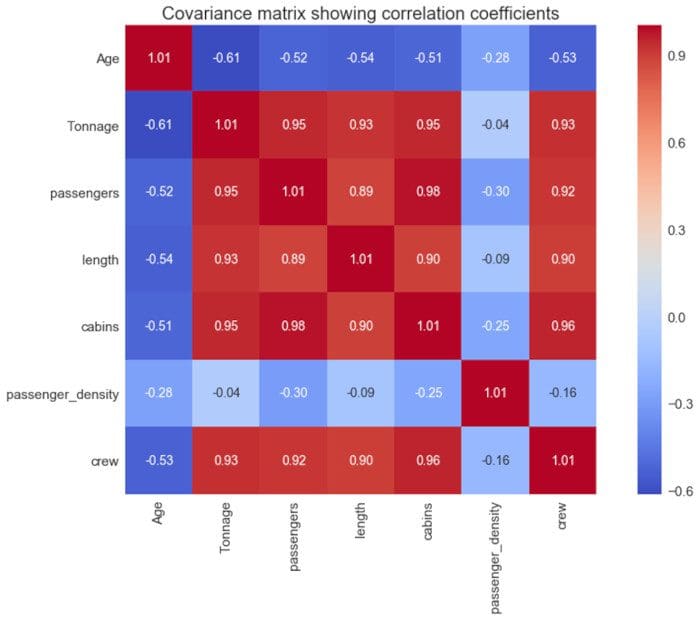
Figure 4. Covariance matrix plot showing correlation coefficients between features in the dataset. Image source: Benjamin O. Tayo.
Weather data plot: Here, the problem is to display record temperatures between the years 2005 – 2014.
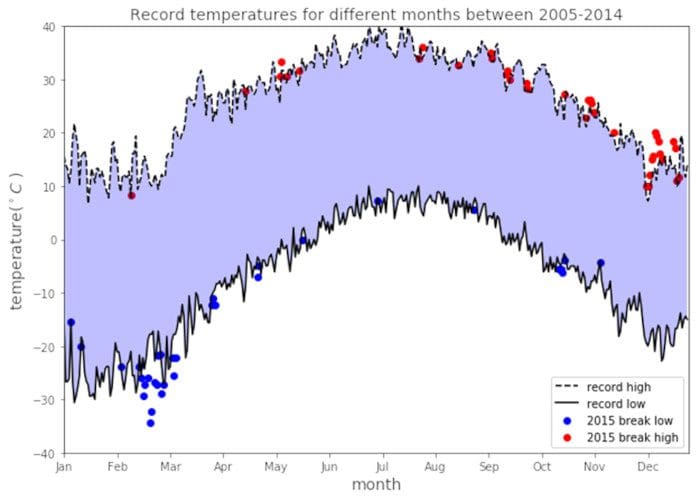
Figure 5. Record temperatures for different months between 2005 to 2014. Image by Benjamin O. Tayo.
Predictive Data Analysis
In predictive analysis, the goal is to build a model using available data that can then be used for making predictions on unseen data. Here, the type of model to build will depend on the type of target variable. If the target variable is continuous, then one can use linear regression, and if the target variable is discrete, then classification could be used. The framework for prescriptive data analysis is illustrated in Figure 6 below.

Figure 6. Illustrating the Machine Learning Project Workflow. Image by Benjamin O. Tayo
The workflow for predictive analysis generally involves 4 main stages: Problem Framing, Data Analysis, Model Building, and Application.
A. Problem Framing
This is where you decide the kind of problem you are trying to solve, e.g. model to classify emails as spam or not spam, model to classify tumor cells as malignant or benign, model to improve customer experience by routing calls into different categories so that calls can be answered by personnel with the right expertise, model to predict if a loan will charge off (default) after the duration of the loan, model to predict the price of a house based on different features or predictors, etc.
B. Data Analysis
This is where you analyze the data available for building the model. It includes data visualization of features, handling missing data, handling categorical data, encoding class labels, normalization and standardization of features, feature engineering, dimensionality reduction, data partitioning into training, validation, and testing sets, etc.
C. Model Building
This is where you select the model that you would like to use, e.g., linear regression, logistic regression, KNN, SVM, k-means, Monte Carlo simulation, time series analysis, etc. The dataset has to be divided into training, validation, and test sets. Hyperparameter tuning is used to fine-tune the model in order to prevent overfitting. Cross-validation is performed to ensure the model performs well on the validation set. After fine-tuning model parameters, the model is applied to the test dataset. The model’s performance on the test dataset is approximately equal to what would be expected when the model is used for making predictions on unseen data.
D. Application
In this stage, the final machine learning model is put into production to start improving the customer experience or increasing productivity or deciding if a bank should approve credit to a borrower, etc. The model is evaluated in a production setting in order to assess its performance. This can be done by comparing the performance of the machine learning solution against a baseline or control solution using methods such as A/B testing. Any mistakes encountered when transforming from an experimental model to its actual performance on the production line has to be analyzed. This can then be fed back into the original model and used in fine-tuning the model to increase its predictive power.
An example of a predictive data analysis project is found here: Machine learning process tutorial.
Prescriptive Data Analysis
Sometimes, the available data may serve only as sample data that can be used for generating more data. The data generated could then be used in prescriptive analysis for recommending a course of action. An example of this is the loan status forecasting problem: Predictive loan status using Monte Carlo simulation.
In summary, we’ve discussed some tips for framing the right questions to be answered using available data. The quality of any analysis performed on data depends on your ability to frame the right questions. It is, therefore, important that the right questions be framed before using data to perform any type of analysis.
Related: