30 Most Asked Machine Learning Questions Answered
There is always a lot to learn in machine learning. Whether you are new to the field or a seasoned practitioner and ready for a refresher, understanding these key concepts will keep your skills honed in the right direction.
By Abhay Parashar, Python Developer | Data Science Learner.
Image By Author.
Machine Learning is the path to a better and advanced future. A Machine Learning Developer is the most demanding job in 2021, and it is going to increase by 20–30% in the upcoming 3–5 years. Machine Learning by the core is all statistics and programming concepts. The language that is mostly used by Machine learning developers for coding is python because of its simplicity. In this blog, you will find some of the most asked machine learning questions that every machine learning enthusiast has to answer one day. Let’s start.
0. What is Machine Learning?
Ans: Machine learning is the science of getting computers to act in a real-time situation without being explicitly programmed. It is an application of artificial intelligence that provides systems to automatically learn and improve from previous experience.It allows computers to learn and adapt to new data without any kind of human intervention.
1. Explain the basic difference between Supervised, Unsupervised, and Semi-Supervised Machine Learning?
Ans:
Supervised Learning: A model is trained on the labeled data, and then it makes predictions based on the previously labeled data. It requires a supervisor (labels) to train the data. E.g., text classification.
Unsupervised Learning: A model is trained on unlabeled data. The model tries to find patterns, relationships in the data and classify the classes according to that. We don’t have any labeled data.
Semi-Supervised Learning: It is a type of machine learning that uses some amount of labeled data and a large amount of unlabeled data to train the model. The goal of this is to classify some of the unlabeled data with the help of labeled data.
2. What do you mean by Reinforcement Learning?
Ans: reinforcement learning is an area of machine learning in which the model is trained according to the rewards given to it based on its previous actions in the environment. There is an agent whose task is to give rewards and also to maximize the rewards. If the model performs the task correctly, it gets a +1 reward, but if it does a task wrong, then it gets a -1 reward.
Applications: Self-driven cars, automatic parking, puzzle solver, and more.
3. What are the different types of data used in Machine Learning?
Ans: There Are Two Types of Data. Structured and Unstructured Data.
1. Structured Data: This type of data is predefined, labeled, and well-formatted before being stored in a data storage. Example: Student Records Table.
2. Unstructured Data: This Type of data is in native format, and it's not processed until it is used. Example: Text, Audio, Video, Emails, etc.
4. Features vs. Labels?
Ans: Features are the input information. On the other hand, labels are the output information for a mode.
Features are used to predict something, and labels are the ones which we predict. Also, features are named as independent variables, and labels are dependent variables.
5. Explain the difference between Regression and Classification?
Ans:
Regression: regression is a process of finding the correlation between the dependent and independent variables. It is helpful in the prediction of continuous variables, such as in the prediction of the stock market, house prices, etc. In regression, our task is to find the best suitable line that can predict the output accurately.
Classification: Classification is the process of finding a function that helps in dividing the data into different classes. These are mainly used in discrete data. In classification, our aim is to find the decision boundary which can divide the dataset into different classes.
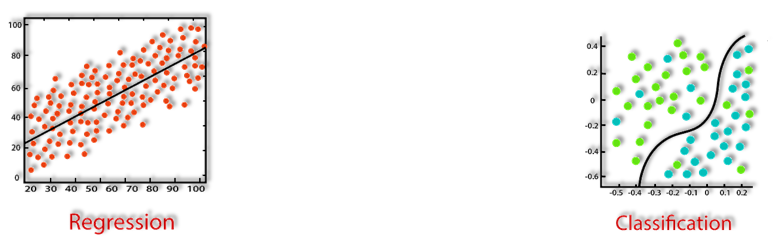
Image By Author.
6. What is Scikit-learn used for?
Ans: Scikit-learn is a robust library in python used for machine learning tasks. The Scikit-learn library contains a lot of efficient tools and classes for machine learning and statistical modeling, including classification, regression, clustering, feature selection, parameter tuning, etc. It is an efficient tool for predictive analysis. It provides all the major algorithms in the form of classes and functions. In python, it is written as sklearn.
7. What are a training set and test set in Machine Learning, and why are they important?
Ans: The Training Set is the set given to the model for training, analyzing, and learning. The Test Set is the set that is used for testing the model locally before using it in a real application. The Training Set is Labeled data, and the Test Set has no labels.
It is important to divide the dataset into training and test sets so that the model will not go in overfitting or underfitting conditions. Also, it is a great method to evaluate the model and understand the characteristics of the data. In most cases, the split is 70/30, meaning 70% of the full data set for training and 30% for testing.
8. Explain the stages of building a Machine Learning model?
Ans:
Data Collection: It is the first stage of any kind of machine learning model. In this stage, the appropriate data is decided, and then it is collected using some algorithm or manually.
Data Processing: In this stage, the data that we have collected in the first stage is preprocessed by handling all the null values, categorical data, etc. Also, in the same stage, the data features are made in the same range if they are not already.
Model Building: In this stage, first, we choose appropriate algorithms to create the model, and then, with the help of sklearn, for example, the model is built.
Model Evaluation: After the model is created, it is evaluated using some techniques of statistics like accuracy score, z score, accuracy matrix, and more.
Model Saving and Testing: After a successful evaluation of the model, it is saved for future use, and real-time testing is done using it.
9. Overfitting vs. Underfitting?
Ans:
Overfitting: It is a condition that occurs when model performance on training data is good but on test data is bad. Example: Model accuracy on the train is 94% and on test 56%. It is a modeling error that occurs when a function is too closely fit a limited set of data points. To avoid overfitting, we can collect more data, use ensembling methods or choose the right algorithm that fits the data best.
Underfitting: Model performance is poor on training data as well as test data. In other words, this type of model failed to generalize the new data points.
“Machine intelligence is the last invention that humanity will ever need to make.” ~ Nick Bostrom
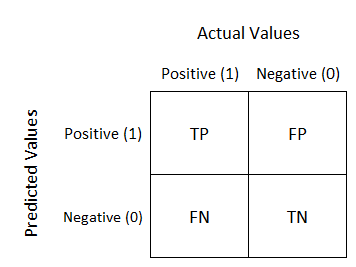
10. Explain the Confusion Matrix with respect to model evaluation?
Ans: The Confusion Matrix is a measurement table that is used to measure the performance of a machine learning algorithm. It is a table of different combinations of predicted and actual values. It is useful for measuring recall, precision, AUC-ROC curve, and accuracy. The diagonal of the matrix contains all the true or correct data. The size of the matrix depends upon the classes in the dependent variable. The matrix size is equal to N*N, where N is the number of classes in the output of the dependent variable.
- True Positive: Actual Value = Predicted Value when o/p is 1
- True Negative : Actual Value != Predicted Value when o/p is 0
- False Positive: Type I Error
- False Negative: Type II Error
11. What is the difference between Type I and Type II errors?
Ans:
Type I Error (False Positive Error): It occurs when the null hypothesis is true, but it gets rejected, meaning it claims something has happened when it hasn’t.
Type II Error (False Negative Error): It occurs when the null hypothesis gets accepted when it's not true, meaning it claims nothing happened when something has happened.
Example: Let’s take the example of a scenario in which a null hypothesis is a person who is innocent. Convicting an innocent person is a Type I error. On the other hand, letting a guilty person go free is a Type II error.
12. Differentiate Precision, Recall, Accuracy, and the F1 Score?
Ans:
Precision is the ratio of correctly predicted positive observation and total predicted positive observation. It shows how precise our model is.
- Precision = TP/TP+FP
Recall is the ratio of the correct predicted positive observation and the total observation in the class.
- Recall = TP/TP+FN
F1-Score is the weighted average of recall and precision.
- F1-Score = 2*(Recall * Precision) / (Recall + Precision)
Accuracy is the ratio of correctly predicted positive observations to the total positive observations.
- Accuracy = TP+TN/TP+TN+FP+FN
13. What does the P-value mean?
Ans: P-Value is the determination of a result when the null hypothesis is assumed to be true. If the p-value is very small (<0.05), then our assumption that the null hypothesis is correct is most likely to be false. Thus we reject the null hypothesis.
14. Explain how a ROC Curve works?
Ans: A ROC curve is a graph showing the performance of a classification model at different thresholds. It uses two curve plot parameters, True positive rate (sensitivity) and False positive rate (Specificity).
- The closer the curve follows the left-hand border and then the top border, the more accurate the test is.
- The closer the curve to a 45 degree diagonal of ROC Space, the less accurate the test is.
15. How is KNN different from K-means clustering?
Ans: KNN is a supervised machine learning technique that is used for classification or regression problems. In KNN, the K represents the number of nearest neighbors used to predict the dependent variable.
K-means clustering is an unsupervised machine learning algorithm that is used to divide the data into different clusters based on K, the number of clusters, and centroids.
16. What is ‘Naive’ in the Naive Bayes Theorem?
Ans: Naive Bayes classifier assumes that all the input variables are independent of each other, meaning they don’t have any relationship between them, which is actually an unrealistic assumption for real data.
Let’s suppose a dataset that contains information about fruits and detects whether the fruit is an apple or not. A sample of this data contains a fruit that is red, round, and about 4'' in diameter. Even if all these features depend on each other or upon the existence of the other feature, a Naive Bayes classifier will always consider them as independent contributors for the prediction of the fruit.
17. How does Ensemble Learning work?
Ans: Ensemble Learning is a technique in which the predictions or results of multiple models are combined to achieve better performance. Let’s take an example of if you buy a car, you generally go for research on the web to search for reviews and features of different cars. In the end, after combining all the reviews, you create your own review of that car and decide whether you want to purchase it or not. The review you create is the better version of all the reviews you read because it contains the information from all the reviews.
Ensemble learning works the same: the predictions from many algorithms are used to create a better model.
Ensemble Learning can be done in two ways. One is to combine different algorithm predictions to generate a new high-accuracy prediction. Another way is to use a single algorithm multiple times and, in the end, use each model prediction to generate a better model with good accuracy.
“Don’t Let Yesterday Take Up Too Much Of Today.” ~ Will Rogers
18. What is bagging and boosting in Machine Learning?
Ans:
Bagging is a method of combining predictions of the same type, meaning from the same algorithm. Ex: Random Forest. In this, each model is built independently with equal weight given to them. It reduces the overfitting problem. It also decreases the variance.
Boosting is a way of combining predictions belongs to different algorithms. Ex: Gradient boosting. The new model is highly influenced by the performance of the previously built models. It reduces the bias.
19. What is a bias-variance tradeoff?
Ans: Bias is the difference between the average prediction of the model and the correct value. On the other hand, variance is the variability of a data point that shows the spread of the data.
If our model has fewer parameters, then it may have high bias and low variance. Because of that, it will be consistent but inaccurate on average. A model with a large number of parameters may have low bias and high variance models, which are mostly accurate on average but inconsistent in nature. A good model always has low bias and low variance.
20. Explain L1 and L2 Regularization?
Ans: A regression model that uses L1 Regularization is called Lasso Regression, and the Model which uses L2 Regularization is called Ridge Regression.
- L1 regularization adds the penalty term in the cost function by adding the absolute value of weight (Wj), while L2 regularization adds the squared value of weights (Wj) in the cost function.
- One more difference between both of them is that L1 regularization tries to estimate the median of the data while L2 regularization tries to estimate the mean of the data.
- L1 regularization helps in eliminating the features that are not important.
21. What are the different ways to handle missing values in Machine Learning?
Ans:
1. Replacing the missing value with the mean, median, or mode.
2. Replacing the missing values with a random value.
3. Taking all the NaN values and using them as a New Feature.
4. Replacing NaN values with the third deviation value.
5. Replacing NaN with Least or Last Outlier
6. Replacing NaN with the most frequent Category (Categorical Values)
7. Treating the missing values as a new category
8. Apply a classifier to predict NaN values
9. Drop Values
Learn more: 9 Ways to Handle Missing Values in Machine Learning
22. What are the different techniques you can use to select Features.
Ans:
- Univariate Selection: In this method, we used SelectKBest Algo to find the feature score with respect to the dependent column.
- Extra Tree Classifier: This technique gives you a score for each feature of the data. The higher the score, the more important and relevant that feature is. You can import the class from sklean.ensemble.
- Correlation Matrix: A table that displays the correlation of all the features against each other. Each cell in the table displays a correlation between two variables. We can use a threshold value to select the less correlated variables out of the dataset.
- Mutual Information: It is a classifier that generates the mutual information of each feature with respect to the dependent feature. The higher the information is relevant it is.
“Torture the data, and it will confess to anything.” ~ Ronald Coase
23. What approaches can be followed to handle Categorical values in the dataset?
Ans: To Handle Categorical Values We Can Perform Encoding That Basically converts the categorical data into numerical data.
- Nomial Encoding: When data do not have an inherent order.
1 One Hot Encoding
1.2 One Hot Encoding with many features
1.3 Mean Encoding - Ordinal Encoding: When data have an inherent order.
2 Label Encoding
2.2 Target Guided Encoding - Count Encoding
Learn more: Different Approaches to handle categorical values
24. What are Outliers, and how can we handle them in Machine Learning?
Ans: Outliers are some unusual data points that differ from the rest of the data points or samples in the dataset. They can make a high impact on the model performance. To handle the outliers, we can do three things.
- Remove all the outliers
- Replace the outlier values with a suitable value (Like 3rd deviation)
- Use a Different algorithm that is not sensitive to outliers.
25. What is feature scaling and transformation, and why are they necessary?
Ans: Feature transformation is a technique to transform features from one representation to another. On the other hand, feature scaling is a technique of converting all the values of a feature in the same range.
Sometimes in our dataset, we have columns that have different units — like one column can be age while the other can be the salary of the person. In this scenario, the age column ranges from 0 to 100, and the salary column ranges from 0 to 10000. There is such a difference between the values of these columns, so because of that, the column having larger values will influence the output more. That will result in a bad-performing model. Thus we need to perform feature scaling and transformation.
26. How can you handle an imbalanced dataset?
Ans: In imbalanced data, samples in each class will have a huge difference between them. For example, one class may have 1000 samples. On the other hand, another class may only have 200–300 samples. In such scenarios, before doing anything, we first need to handle the imbalance of the data. There are many techniques we can follow.
- Collect more data.
- Apply oversampling when we have a large amount of data
- Apply undersampling
- Try some other algorithm
27. What is A/B Testing?
Ans: A/B Testing is a statistical hypothesis test for randomizing experiments with two variables. It is usually used to compare two models that used different predictor variables in order to check which fits the data best.
In a real-world scenario, suppose you create two models that recommend products for users. A/B testing can be used to compare these two models to check which one gives the best recommendations.
28. What is Cross-Validation in Machine Learning?
Ans: It is a technique for increasing the model performance by feeding multiple sample data from the dataset. The sampling process is done by breaking the data into smaller parts that have the same number of rows. Out of all the parts, one is randomly selected for the test and another one for train sets. It consists of the following techniques:
- k-fold cross-validation
- Holdout method
- Stratified k-fold cross-validation
- Leave p-out cross-validation
29. What is PCA, and how is it useful?
Ans: PCA (Principal Component Analysis) is a dimensionality-reduction method that is used to reduce the dimension of the large data sets.
In real life, we usually come across datasets that have large dimensions, and because of that, visualizing and analyzing those datasets become difficult. PCA can help to reduce the dimensionality of the dataset by removing unnecessary dimensions from the dataset.
“The More You Learn, The More You Earn.” ~ Warren Buffett
30. How is a pipeline used in Machine Learning?
Ans: A pipeline is used to automate machine learning workflows. A pipeline consists of several steps to train a model. These pipelines are iterative, so every step is repeated many times to improve the accuracy of the model.
The pipeline is mainly used in NLP. One part of the pipelines doing the cleaning and vectorization one the other hand another part of the pipeline doing the model training and validation.
Original. Reposted with permission.
Related: