A Comparison of Machine Learning Algorithms in Python and R
This list of the most commonly used machine learning algorithms in Python and R is intended to help novice engineers and enthusiasts get familiar with the most commonly used algorithms.
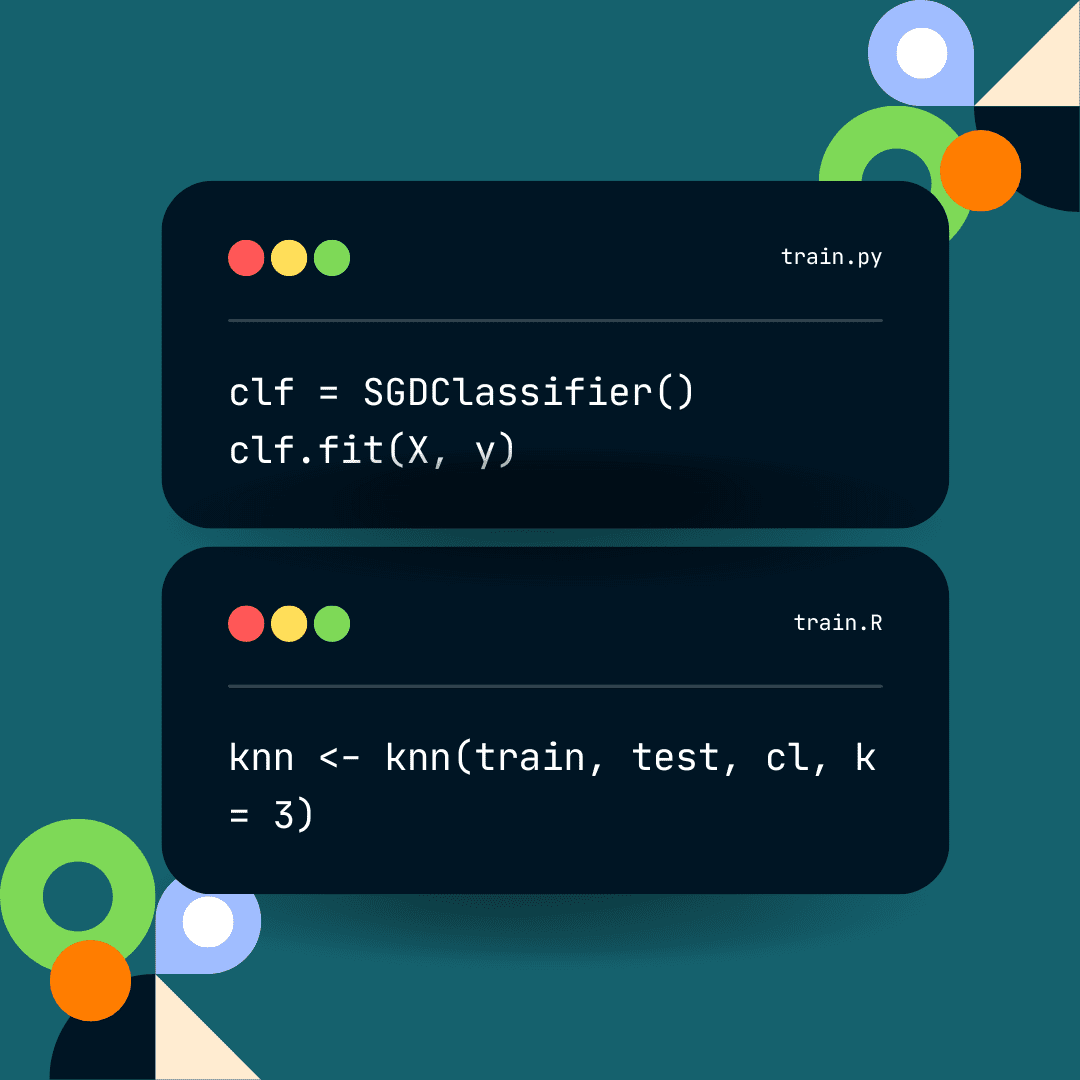
Image by Editor
Python and R are two of the most used programming languages for machine learning. Both are open source and highly accessible, but where Python is a general-purpose language, R is a statistical programming language. This makes it ideal for various data roles and applications, such as data mining.
The two programming languages also encourage re-usability, meaning novice machine learning engineers and enthusiasts don’t have to write their code from scratch. Using them to build projects is about integrating the right modules and algorithms - all you have to know is where to look. To help you out, we’ve compiled a list of some of the most used machine learning algorithms for Python and R. Make sure to bookmark this guide and reference it whenever you get stuck.
1. K-Means Clustering Algorithm
As the name implies, machine learning is ultimately about teaching computer systems so they can function autonomously. This can either be facilitated through supervised or unsupervised learning.
One way to perform the latter is using the k-means clustering algorithm, which seeks to find patterns in a data set by grouping (clustering) similar data points.
In the R programming language, k-means clustering is generally performed using the k-means function. Unfortunately, Python doesn’t seem to offer an out-of-the-box solution that’s as straightforward. K-means clustering for Python is usually carried out using the sci-kit-learn library’s sklearn.cluster.KMeans class in conjunction with the matplotlib.pyplot library.
The k-means clustering algorithm is one of the most widely used for unsupervised machine learning, and you’ll likely run into it or need to use it sooner or later. Thus, it’s one of the first ones you should learn and master.
2. Decision Tree
The decision tree algorithm is favored because of its accessibility and usability. It’s a supervised machine learning algorithm that is mostly used for classification. For instance, companies can use it to determine how to handle difficult customers through chatbots.
The decision tree teaches machines how to make choices from prior experiences. One of the reasons it is so popular among new machine learning engineers is because it can be modeled and represented visually as a chart or diagram. This quality makes it appealing to those with traditional programming skills.
There are two main types of decision trees:
- Continuous Variable Decision Tree: Refers to decision trees with unlimited target variables.
- Categorical Variable Decision Tree: Refers to decision trees with grouped limited target variables.
The packages and classes that are most concerned with decision trees in R programming include:
- Datasets
- caTools
- party
- dplyr
- magrittr
Once again, you’ll have to look outward for Python modules to implement this algorithm. As with the k-means clustering algorithm, sci-kit-learn contains a host of modules for decision trees with sklearn.tree being the most relevant. You can also use the Graphviz module to render a graphical representation of your decision tree programmatically.
3. Linear Regression Analysis
Linear regression is another well-used supervised machine learning algorithm. The goal of linear regression analysis is to deduce an outcome or value based on a variable or set of variables.
Like most algorithms, the best way to visualize this is using a graph with two axes. The Y axis represents the dependent variable, while the X holds the independent variable. Linear regression analysis’s goal is to form or find a relationship between these two variables.
If an increase in the independent variable causes an increase in the dependent variable (similar to exponential growth), this is known as a positive relationship. On the other hand, if the dependent variable’s value decreases as the independent variable’s value increases (similar to exponential decay), this is known as a negative relationship.
We use a line of best fit to determine the relationship, which can be represented using the slope-intercept linear equation y=mx+b.
But how do we facilitate linear regression in R and Python? The packages most concerned with linear regression analysis in the R programming language are:
- ggplot2
- dplyr
- broom
- ggpubr
The gg packages are used for creating and plotting graphs, whereas dplyr and broom are used to manipulate and display data. sklearn.linear_model can be used to build your linear regression model in Python. You can also add NumPY to process large matrices and arrays.
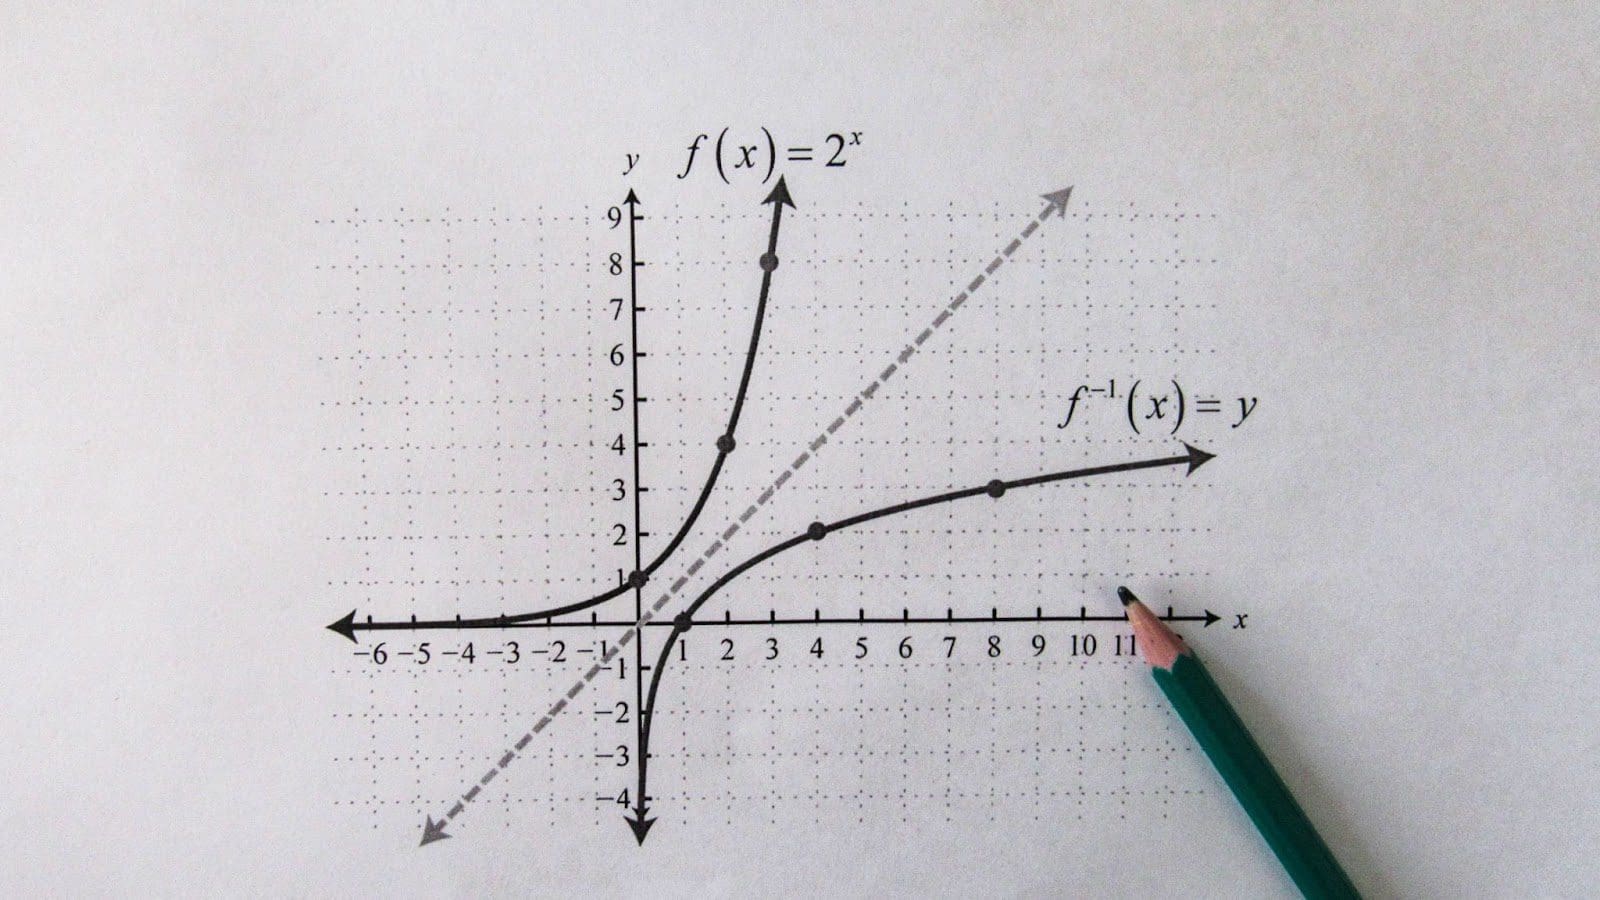
Photo by Pexels
4. Logistic Regression
As with linear regression, logistic regression allows us to predict the value of a variable based on another (set of) variable(s). However, where linear regression uses metric values, logistic regression uses discrete variables. These are dichotomous variables that can only have one of two values (yes or no, 0 or 1, true or false, etc.).
In the real world, this can be used to determine the likelihood of a person purchasing a product (retail) or the likelihood of them carrying a disease (healthcare). For instance, we could use age, height, and weight as independent variables (x). And the binary outcome would be the dependent variable (y). Thus, x is the domain of real numbers, and y contains discrete values.
The goal of logistic regression is to estimate (predict) the probability of an outcome or occurrence. Because the values of the y values are binary, we can’t use a linear equation and must use an activation function instead.
The Sigmoid Function is used to represent logistic regression:
f(x) = L / 1+e^(-x)
or
y = 1/(1+e^-(a+b1x1+b2x2+b3x3+...))
The Python packages and modules most concerned with logistic regression are:
- matplotlib.pyplot
- sklearn.linear_model
- sklearn.metrics
The procedure for generating logistic regressions with R is much simpler and can be done using the glm() function.
5. Support Vector Machines
Support vector machine (SVM) algorithms are primarily used for classification but can also be used for regression-based tasks. SVMs are one of the simplest approaches to classification.
In an SVM, the object that must be classified is represented as a point in an n-dimensional space. Each coordinate of this point is called its feature. SVMs attempt to classify an object by first drawing a hyperplane so that all points of each category are on either side.
While there could potentially be multiple hyperplanes, SVM attempts to find the one that best separates the two categories. It mainly achieves this by finding the maximum distance between the categories, known as the margin. The points that touch or fall directly on the margin are called the supporting vectors.
Since SVM is a supervised machine learning method, it requires training data. You can implement this machine learning algorithm in Python using sklearn’s dedicated SVM module. SVMs in R are typically handled using the contour and plot functions.
Conclusion
Many of these algorithms are a testament to how heavily reliant machine learning is on probability and statistics. Although R predates modern machine learning engineering, it’s relevant to it because it is a statistical programming language. As such, many of these algorithms can easily be built or implemented out of the box.
Python is a multi-paradigm general-purpose programming language, so it has a wider array of use cases. Sci-kit–learn is the most trusted library for Python machine learning modules. If you want to learn more about the above algorithms and more, visit the library’s official website.
Nahla Davies is a software developer and tech writer. Before devoting her work full time to technical writing, she managed — among other intriguing things — to serve as a lead programmer at an Inc. 5,000 experiential branding organization whose clients include Samsung, Time Warner, Netflix, and Sony.